 Earth Science Today
Russ Colson
Minnesota State
University Moorhead
Weather and Climate:
Topic 2: Climate, ice ages, and
global warming
Weather is usually extraordinary. It is never quite like the average. People are regularly commenting, “Climate must be changing, because the weather’s not like it used to be”.
But which weather variation constitutes a climate change and which variation is just a normal blip in a long-term pattern? Our recorded weather data goes back one to two hundred years, and our anecdotal stories of weather back a ways farther. But what does a climate change that spans tens of thousands of years look like and how could we recognize it in Earth’s storybook?
Climate does change. In West Virginia and Kentucky, pollen from bogs indicates climate was cooler there in the past than it is now. Sediments in the northern tier of states like Minnesota, Wisconsin, Michigan, Ohio, and Pennsylvania bear witness to the mile thick glaciers that used to be there. The geologic record of weather for the past 100,000 years or so is fossilized in the ice of the polar glaciers. Layer upon layer, Greenland’s winter snows cover the summer’s dust and form a variegated stratigraphy in the ice that bears the global climate’s signature. Greenland ice core data indicate that over the past 100,000 years, average yearly temperatures have varied by 9 to 18°F from the modern average.
- What is Climate?
Climate differs from weather in that it refers to a long-term average of weather conditions. In thinking of climate, one does not only consider average temperature or precipitation for a region, but the average variations in temperature and precipitation with season. Thus the climate of San Francisco, with an average annual temperature of about 56.5°F is very different from St. Louis with an average annual temperature of 56.2°F. In San Francisco, the average monthly temperature varies from about 60°F in summer to 50°F in winter. In St. Louis, average monthly temperatures in summer approach 80°F and winter monthly temperatures are 32°F. In addition, average yearly temperatures in St. Louis vary from 47 to 65°F degrees. Those in San Francisco vary only from 50 to 63°F. The lower variation in temperature from summer to winter, and from year to year, in San Francisco is due to the moderating influence of the nearby Pacific Ocean. Thus, climate is affected not only by latitude, but by presence of oceans or other bodies of water, mountain ranges, and many other geographical factors.
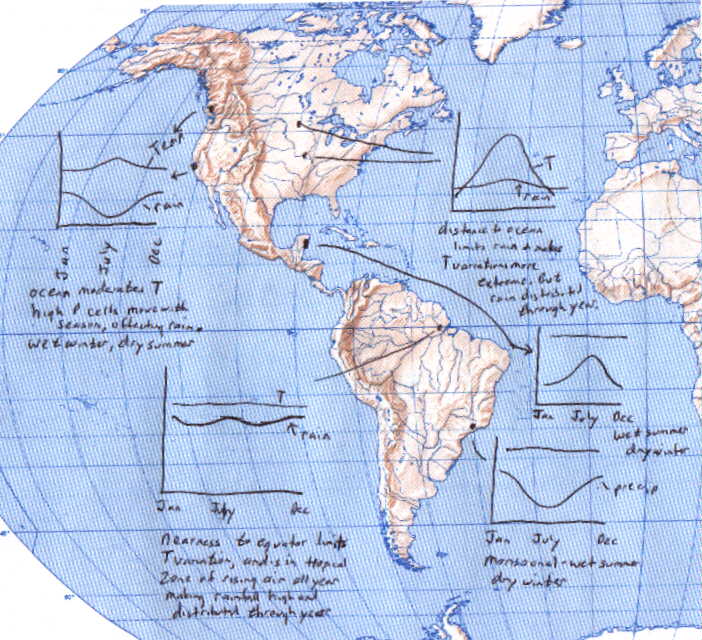
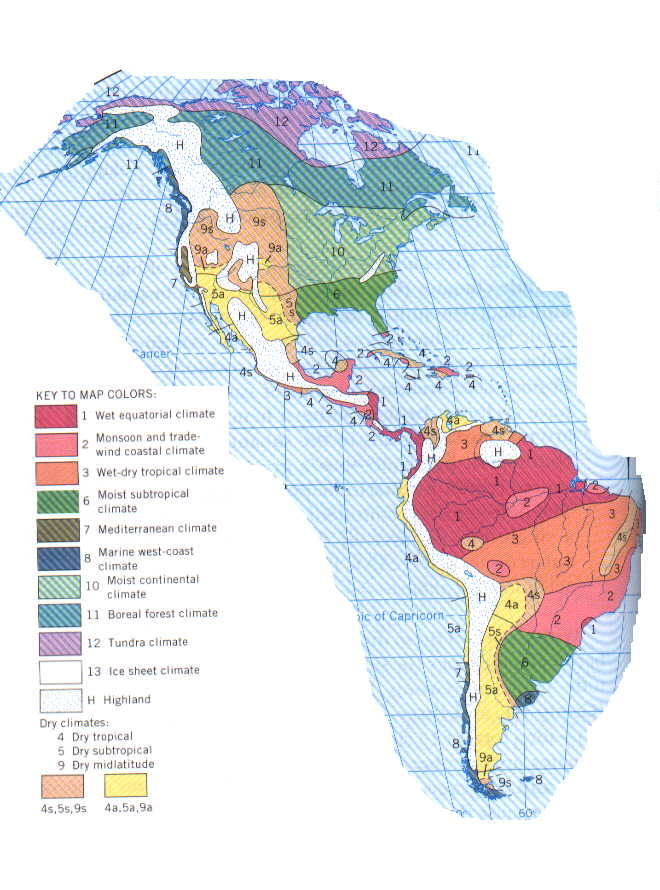
Precipitation also can change with season. Some places have precipitation distributed more or less evenly throughout the year. Other places get most of their precipitation in summer or winter. Some places get lots of rain, others places are extremely dry. (illustration of precipitation and temperature patterns for some selected locations). (Climate zone map, credit: modified from Strahler and Strahler, Introducing Physical Geology.)
This combination of patterns of temperature and precipitation (and other weather variables as well), constitutes what we call climate.
(Note: the averages reported here are for the years
1936-1975)
- Heat balance and atmospheric structure.
We can understand
the big picture of climate by considering the balance of heat coming into and
leaving Earth. Because the Earth is neither catastrophically heating up or
cooling off, we can infer that, to a very good first approximation, the amount
of energy arriving from the Sun is very nearly equal to the energy leaving
Earth for space. There are lots of things that can happen to that energy from
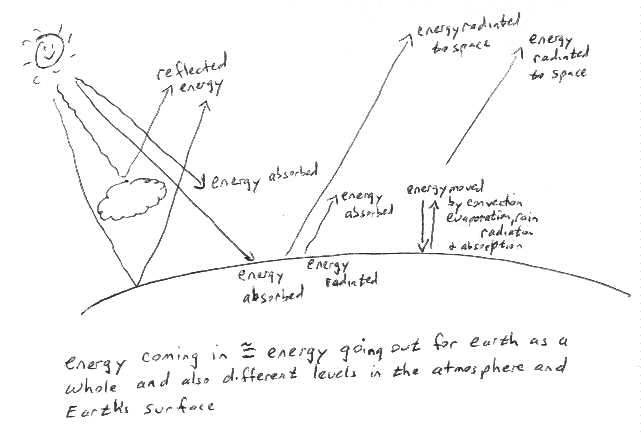
the Sun as it interacts with Earth. As a thought exercise, try to construct a
flow-diagram of the movement of energy from the time it approaches Earth from
the Sun until it leaves. Think about the big picture or what can happen to that
energy. Consider both the surface of the Earth, and the atmosphere of the Earth
as two different places with which the energy can interact. (hints)
Absorption of
energy in the atmosphere does not occur equally in all places (ice at the poles
reflects more, black dirt on a tilled field absorbs more). It does not always
occur at the same elevations (cloudy areas might reflect more light before it
reaches the surface). It does not occur equally with latitude or with season
(As we talked about in the section on the Earth’s seasons). In addition,
different wavelengths of energy from the Sun will be reflected or
absorbed in different ways and in different places. In fact, some wavelengths
are absorbed in Earth’s atmosphere while other wavelengths pass through.
This can be understood in concept by playing with a red laser (like are used as
pointers) and different colored filters. Put a yellow and red filter together
and the laser shines through them almost undiminished in brightness. Put a green
and blue filter together and the red laser beam is mostly completely absorbed
in the filters. Likewise, some wavelengths of light are absorbed in our
atmosphere and some are not. (Do you know one part of the electromagnetic
spectrum that is not absorbed much by our atmosphere? Answer: Yes, of
course you do. But what is it? Answer).
The differential
absorption of energy at different levels in our atmosphere is what produces the
structure of our atmosphere. Our atmosphere is divided into different layers
according to how the temperature of the layer changes as one goes upward.
Differences in how the temperature changes is related to absorption of energy
in different layers and to temperature changes due to adiabatic “cooling”
which we talked about in the section on winds and rain. (illustration
of structure of Earth’s atmosphere with absorption in different levels).
Note: The absorption of ultraviolet radiation in the stratosphere is by ozone.
This is why the ozone hole is of concern to us, since the ozone in the
stratosphere protects life on Earth’s surface from this radiation.
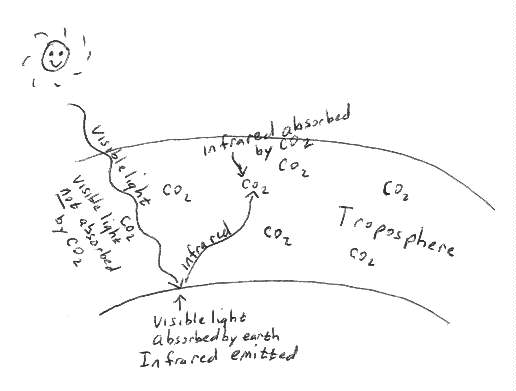
Differential
absorption of different wavelengths of energy by our atmosphere also explains the
“greenhouse” effect. The Sun’s energy is mostly in visible light
and passes through our atmosphere to the surface of the Earth where some of it
is absorbed. The Earth is also “glowing”, radiating energy back out
toward space, but because of the Earth’s cooler temperature the energy it
radiates is in the infrared part of the spectrum rather than visible light.
Water, carbon dioxide, methane and other minor components of our troposphere
absorb the infrared radiation, intercepting that energy before it escapes to
space and causing the Earth’s temperature to be higher. (illustration) (Some extra
comments on chemical differentiation and balance of CO2 on Earth).
One of the big
clues to past climate change is found right here in our own back yard. Glacial
Lake Agassiz once filled the Red River Valley. The presence of the lake was the
consequence of a large glacier to the North that dammed the Red River. The
evidence for the existence of Lake Agassiz includes the muddy lake sediments
beneath us, the sandy beach lines on the East and West sides of the valley, and
the strandlines on either side of the lake where the lake waves cut scarps into
the shoreline. We will look at these on our field trip.
Outside the
valley, we find glacial till. Glacial till is the poorly sorted sediment which
we find associated with modern glaciers. The topography outside the valley (the
rolling hills that are poorly drained, with potholes, lakes, hills and
depressions) are characteristic of a terrain shaped by large glaciers.
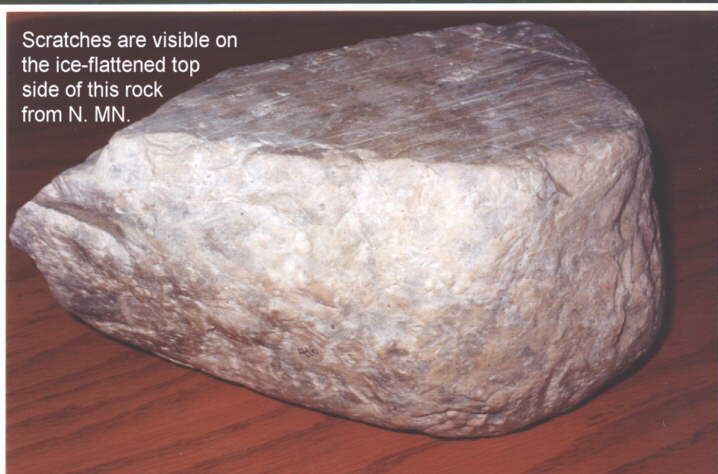
We also find
Striated Boulders in our region. These are rocks where the ice, with sand
imbedded in it, scrapped over the rock like sandpaper. Again, these tell a
story of a time when a glacier covered our region. (picture
of striations)
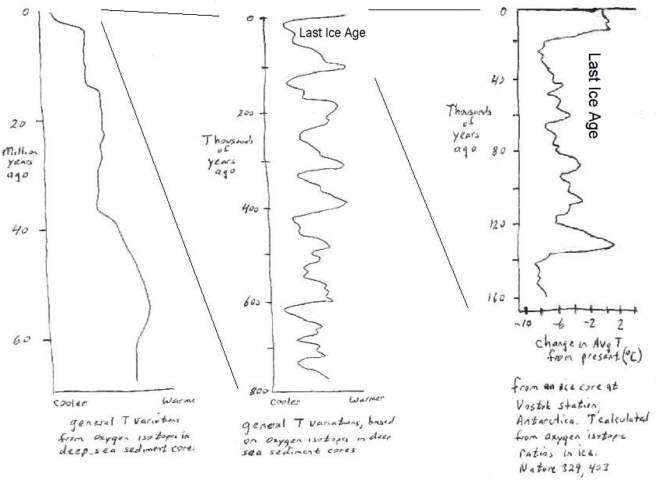
Cores taken into
ancient glacial ice (such as in Antarctica or Greenland) also reveal past
climate changes. Layers of ice build up year after year as snowfall in winter
is layered with dust in summer. Samples taken from progressively deeper layers
can be analyzed for isotopes of oxygen (which reveal average temperatures),
carbon dioxide, and other components that tell us about the atmosphere and its
behavior in the past. (illustration of past climate
changes based on ice cores)
Cores from sea
bottom sediment can also reveal past climate change in a similar fashion. Both
the types of fossils found, and the oxygen isotopic composition of them, reveal
changes in global water temperature.
Long-term changes
in climate of particular regions can result from plate tectonic activity.
Movements of plates can cause continents to move from tropical to polar areas
or vice-versa. In addition, the movements of plates, formation of new mountain
ranges or erosion of old ones changes the circulation patterns of air or ocean
water which can drastically affect climate. Volcanic activity resulting from
plate tectonics can influence climate by emitting CO2, which can cause
greenhouse warming, dust, or sulfur compounds which can increase the
reflectiveness of Earth’s atmosphere resulting in less sunlight reaching
Earth.
Shorter term
variations in climate (such as the more geologically recent ice ages and warmer
intervals between glacial advances), appear to be correlated to variations in
Earth’s rotation and its orbit around the Sun. This is called the Milankovitch
theory after the Serbian scientist who first observed and described the
correlation. There are three variables in the Milankovitch model:
The tilt of
Earth’s axis
This influences seasons as described in the section on
space and planets. The tilt of Earth’s axis is constantly changing, going
back to its original position about every 41000 years.
The precession
of the tilt
This influences at what point in Earth’s orbit
around the Sun that each season occurs. Today, the Northern Hemisphere winter
happens when Earth is closest to the Sun, but that has not always been the
case. This returns to its original configuration about every 22000 years.
The eccentricity
of Earth’s orbit around the sun
This affects how close to and far from the Sun that Earth
gets each year as it orbits the Sun. This goes back to its original
configuration about every 100000 years.
By considering each of these things changing with the
others, it is possible to estimate how the amount of energy reaching earth has
changed over the past 750000 years. The predicted changes in energy correspond
to the observed changes in climate over that period of time.
Variations in
the Sun itself may cause changes in climate. We know that the Sun changes
its energy emission on a 22-year cycle (the sunspot cycle). There may be
longer-term variations in the Sun’s energy output as well. However, we do
not understand the Sun well enough to accurately predict its past behavior or
its future behavior. Maybe someday we will examine the “soils” on the
Moon, where the absence of an atmosphere has allowed the Sun’s light to
strike the surface unhindered for billions of years. The imprints of the solar
wind in the minerals of the Moon’s surface may allow us to understand more
about how the Sun has changed through time.
- Climate feedback examples.
We hear lots of conflicting information about whether the
Earth is warming or not, and what the consequences of a warming might be. The
reason for this apparent conflict is that climate is an extremely complex result
of many interacting components of our Earth’s system. Changing one part of
that system can have unexpected consequences on another part. Even in the 1800’s,
when scientists were first discovering that there was once a great Ice Age,
scientist realized that an ice age might actually be the consequence of warmer
temperatures. They reasoned that warmer air holds more water (see the section
on rain!), so warmer air could result in more water, and thus more snow, in
more northern latitudes, possibly resulting in formation of glaciers over many
years. Following are some example feedback loops that might influence climate
in unexpected ways.
Suppose that the atmosphere gets warmer. What consequences will that have on the concentration of CO2 in the atmosphere? (think about plant growth and temperature) (one answer)
Suppose that the warming atmosphere warms the oceans. What consequences will that have on the concentration of CO2 in the atmosphere? (think about CO2 in your can of coke) (one answer)
Suppose that warming atmosphere melts ice at the poles. What consequences will that have on further climatic change? (think about reflection and absorption) (one answer)
Future climate comments.
We don't know for sure what natural variations in climate we might expect in
the future, although evaluation of past climate variations (such as shown in
one of the figures above) might suggest we could go into another ice age.
Perhaps "global warming" is a good thing in that it is compensating
for an otherwise cold slide into glaciation! But the potential also
exists for a "runaway" greenhouse effect, as seen in the example
positive feedback loops above. Scientists are working toward understanding
of our climate in the typically methodical (plodding?) way of science.
This can be frustrating for policy makers who want concrete answers now.
The ambiguity and uncertainty of science as it explores a new thing, which are
a part of the scientific process, can often confuse people about the purpose
and nature of science. But there are things we really do know. The
key to understanding science is identifying what we do know, and how we know
it, and what we don't know, and how we might learn it.
Field Trip: Geological
stories of regional climate change.
(This file will take about 8.4 minutes to load
at 14.4K baud rate)
What causes the Seasons, learning activity (in MSword)
Home Page (est.htm)
Previous Page (est4.html)
Image
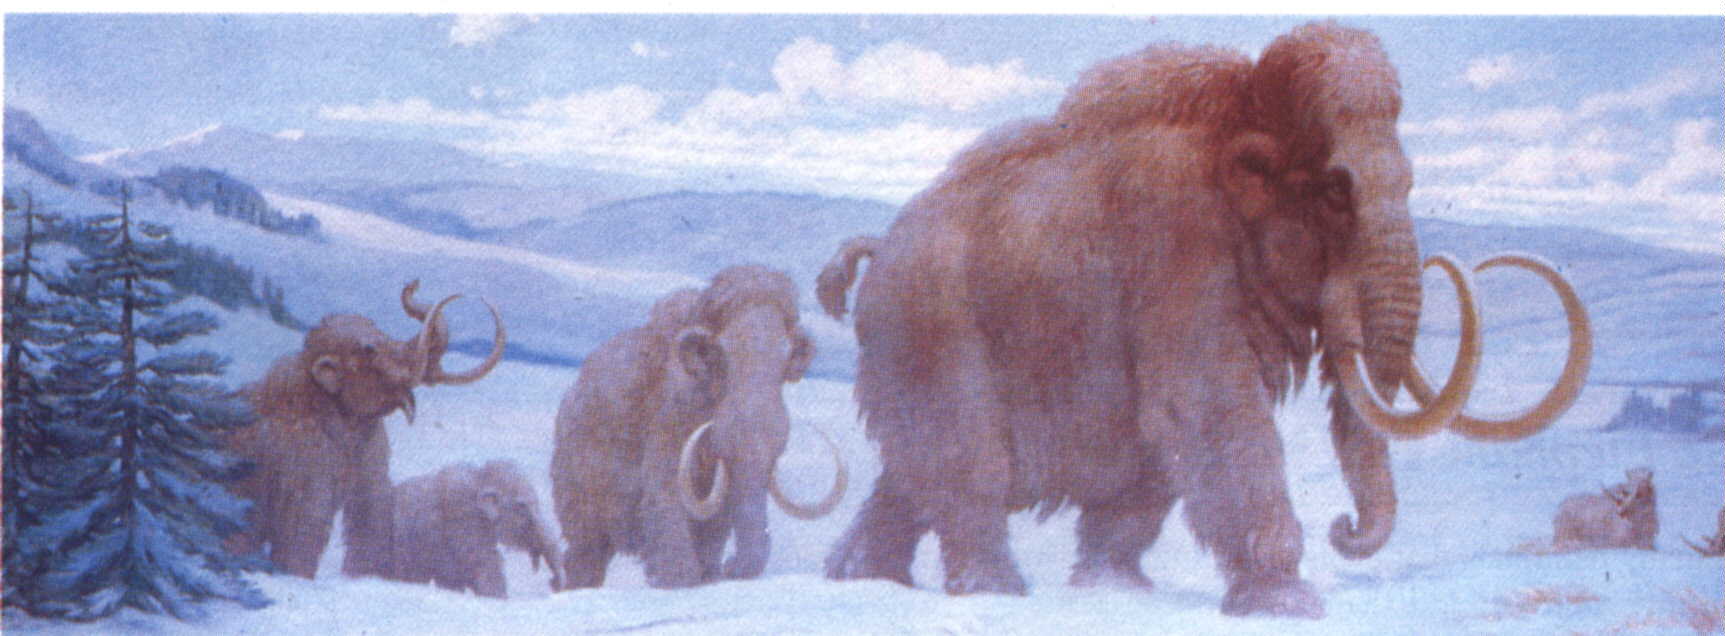
credits: The painting of the woolly mammoths is by C. R. Knight and is owned by
the Chicago Museum of Natural History.