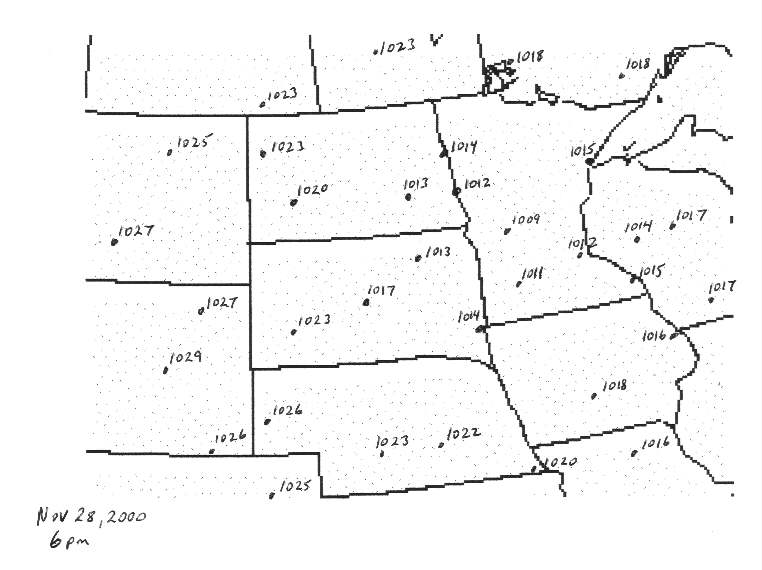
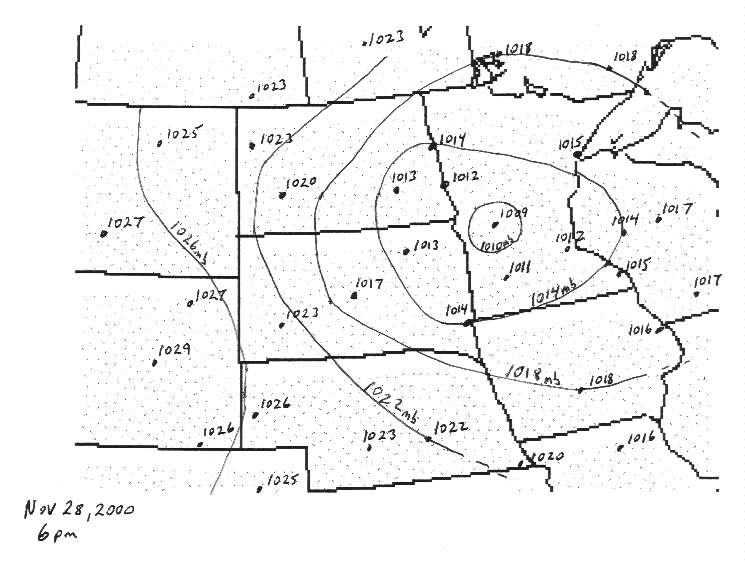
Exercise in drawing isobars
Isobars are lines showing points of equal air
pressure on a map. An isobaric map is analogous to a topographic
map, where, on a topo map, lines represent points of equal elevation.
An isobaric interval is chosen depending on how many isobar lines
are desired. For example, an interval of 4 millibars means that an
isobar line will be drawn for every 4th millibar increment in air pressure
(1 atm pressure is about 1000 millibars). So one might draw isobars
for 992mb, 996mb, 1000mb, 1004mb, and so on.
Drawing isobars is not a matter of connecting the
dots. Rather, you have to interpolate between points where actual
pressure are known in order to figure out where an isobar line will pass
between points.
Try to figure out the isobars for the map below with data from Nov 28, 2000, when 5-11 inches of snow fell in the Fargo-Moorhead area due to a low pressure center Southeast of town. Drawing the isobars should reveal the location of the low-pressure center as well as regions of higher pressure. Label your isobars as 1000mb, 1004mb, 1008mb, 1012mb, 1016mb, 1020mb, and 1024mb (4millibar isobaric interval).
Home Page (est.htm) Previous Page (est4a.html)