Surface Water Hydrology
Earth Science Extras
by Russ Colson
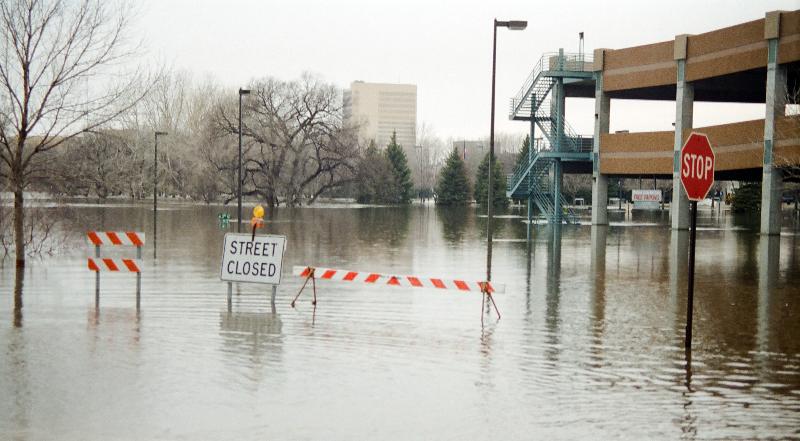
At 28800 cubic feet per second at the crest in Fargo ND, the flood of 1997 on the Red River was, at the time, the largest flood in history. It seriously threatened Fargo and devastated Grand Forks.
Drainage Basins
The water cycle involves water evaporating from the oceans, moving over land by winds, precipitating, and then running under the force of gravity back to the sea. When water falls on a particular landscape, the direction that it flows, wether above or below ground, depends largely on the downhill direction of the landscape. Water finds it way to gullies, from gullies to small stream, from small stream to larger streams, from larger streams to rivers, and eventually to the sea. The total area that a stream or river drains, is called the drainage basin of that stream or river. Understanding the drainage basin of a river is important in predicting how much rainwater or snow melt might come down that river--the bigger the drainage basin, the higher amounts of water are likely for any given amount of precipitation.
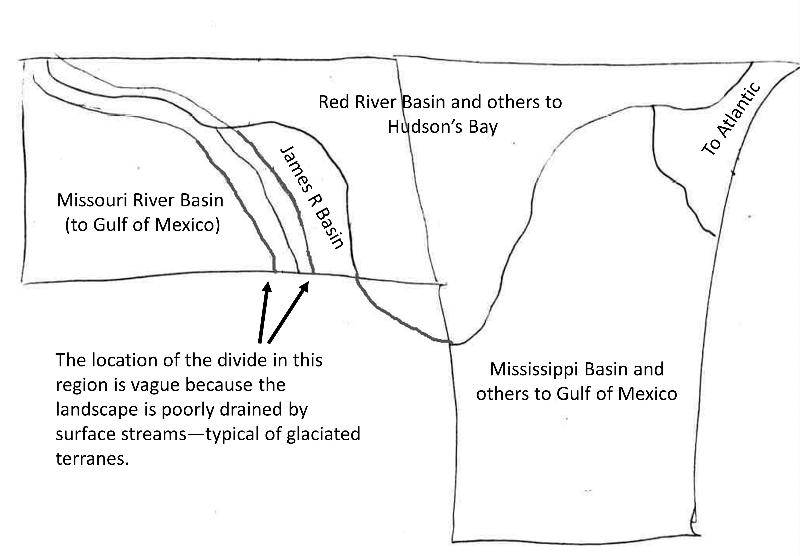
A divide is the boundary where a drop of water that falls on one side of the boundary will move by gravity toward one drainage basins, and a drop of water falling on the other side of the boundary will move toward a different drainage basin. A continental divide is a divide where water on one side will flow by a variety of rivers toward one ocean, and a drop on the other side will flow toward a different ocean. For example, Colorado has continental divides that send some water toward the Gulf of Mexico and some toward the Pacific Ocean. Minnesota has a rare triple divide, where rain in the northwest flows toward Hudson's Bay via the Red River and other rivers, rain to the south flows toward the Gulf of Mexico via the Mississippi and other rivers, and rain in the northeast flows toward the Atlantic, via the Great Lakes and St Lawrence Seaway.
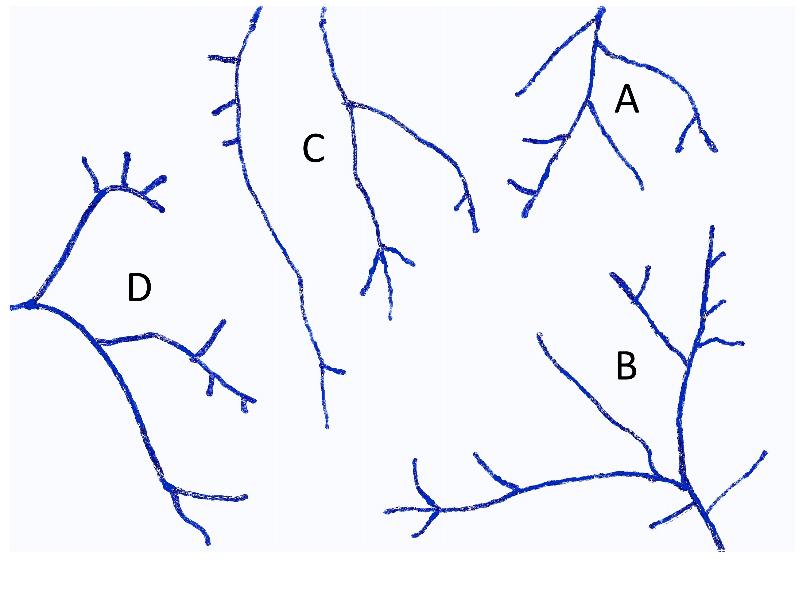
For the stream below, draw boundaries around each drainage basin (the boundaries being divides).
Below is a simplified topo map of the same drainage basins as shown in the problems above. The red lines represent only the major topo lines (that is, every fifth line on a regular topo map).
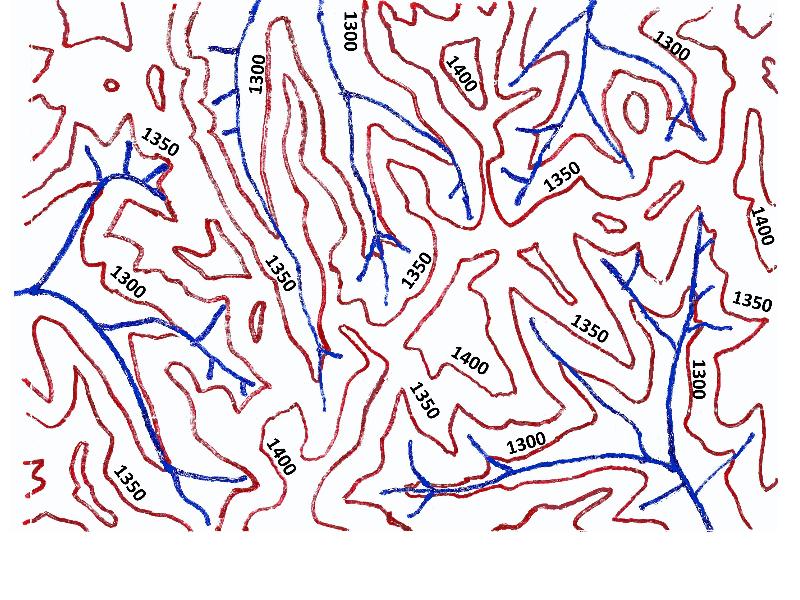
We are going to do a more detailed exercise like we did above, drawing the boundaries between drainage basins. Remember, water will flow downhill, so the key is to find the ridges, saddles, and high points that separate one drainage basin from another, and this will be where the divide goes.
Now, let's practice identifying drainage basin divides based on a topographic map.
Draw boundaries between drainage basins on the map below. Remember, water will flow downhill, so the key is to find the ridges, saddles, and high points that separate one drainage basin from another, and this will be where the divide goes.

In the real world, we observe that not all of the water that falls in a drainage basin immediately ends up in the river. There are two important considerations, 1) some water goes other places than into the river and 2) there is a lag between rainfall and the water going down the river.
Runoff
The amount of water carried by a river is related to the size of the basin, the amount of rainfall,the rate of runoff (which is a function of the condition of the soil as well as the rate of precipitation or snow melt), and amount of water intercepted and stored. There has to be a mass balance between how much rain or snow falls and the total amount of water on and under the land, such that
precipitation = runoff + interception + storage
interception = evaporation, transpiration, infiltration. Infiltration is the movement of water into unsaturated soil and sediment, and this water may find its way into streams eventually, but with a lag time, or this water may be used by plants or it may evaporate.
storage = snowpack, groundwater, and undrained ponds and lakes that supply groundwater. This water, too, may eventually get into rivers.
runoff depends on slope, permeability of the soil, vegetation, degree of soil saturation, etc.
In planning for flash-flooding (floods due to a short, high-intensity rainfall event), one has to consider not only the amount of precipitation falling in a region, but how much of that water soaks into the ground and how quickly the rest runs off.
Runoff depends on slope, permeability of the soil, vegetation, degree of soil saturation, and so on. We can think about the runoff and its rate using a graph of water volume versus time, as shown below. This graph sketches in examples for rainfall, urban runoff (with lots of concrete and roads), and non-urban runoff (with vegetation, etc). The total water volume is shown by the area under each curve, while the height of each curve shows the maximum rate at any one time.
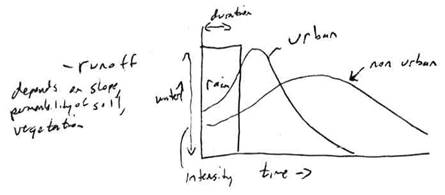
Models have been developed to predict runoff amounts and rates for many different conditions of soil type, landscape slope, rainfall rate, and other factors. I have taken one of these models and developed a spreadsheet algorithm to calculate the peak runoff values and how long it takes to reach that peak for a particular flood event. This algorthm is available at
Using this algorithm, answer the following questions. These questions will require that you not only figure out how to use the spreadsheet algorithm, but try out different possible conditions and figure out what the model predicts for the different changed conditions.
If you are unsure how to 'figure out' the spreadsheet model, or what to do first, you can check out a primer on it in the file Preparation_for_Flood_Water_Runoff_Modeling_Lab.pdf
Discharge and Flow--Some Engineering and Math
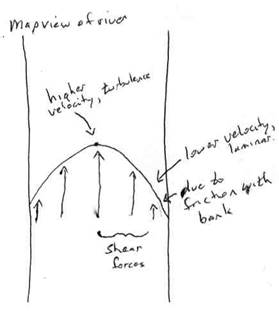
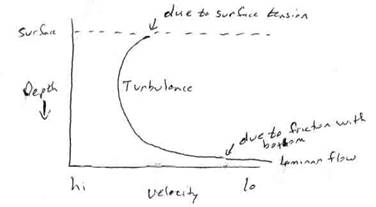
Water will in general flow faster where there is less friction, which happens away from the banks and bottom of the river. Even friction with air and water surface tension will have some effect on velocity. The pictures below illlustrate some of the typical relationships.
The flow of water can also be either
Laminar: water in thin sheets that flow smoothly over and past each other
![]()
or
Turbulent: seemingly-random chaotic flow, eddies
![]()
Turbulence will increase erosion and cause the water velocity to slow down. Consequently, in bulding diversion channels for rivers, engineers try to minimize turbulence and maximize laminar flow, while at the same time maximizing velocity and discharge.
The tendency for any gas or fluid to be either laminar or turbulent can be predicted using the dimensionless Reynolds Number:
:
Reynolds number = R = ρ dv/ µ ; rho (ρ) = density, mu (µ) = viscosity, d = depth, v = velocity.
The Reynolds number is used not only in studies of river flow, but also in studies of jet and rocket engines. So yes, this IS rocket science!
We are going to only look at this equation qualitatively, but, in general, if the Reynolds Number is less than 500 then we get laminar flow, if it's greater than 1200 then we get turbulent flow.
Mathematical thinking involves more that simply plugging numbers into a calculator. In science, numbers have meaning in the real world. How will changing the velocity of stream affect the turbulence? What about depth? What about chainging the density, or the viscosity? Look at the equation and think about what it tells us about these relationships.
We can model or predict stream flow velocity using the empirical Manning Equation.
Velocity = v=(1.49/n) R2/3S1/2
For the following question, consider the drawings of imaginary diversion channel cross-sections below. Slopes are not realistic but are used as a conceptual problem.
Discharge is how much water a river carries per unit time. For example, we used units of cubic feet (a volume) per second (a time) in our problems above.
If we imagine a stream channel with a rectangular outline, we can portray discharge as shown in the diagram below.
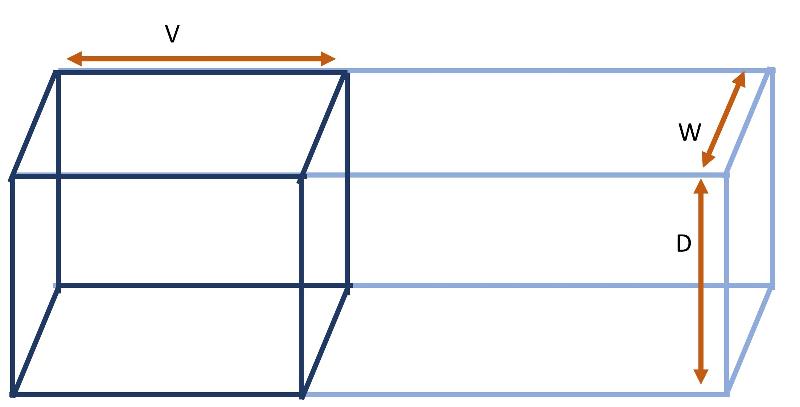
where D = depth of the stream, W = width of the stream, and V= the distance that the water travels in one second (that is, the velocity).
Notice also that D x W = cross sectional Area of the channel (=A).
So we can write an equation for the discharge where
Discharge = Q = D x W x Distance/time = D x W x V = A x V.
notice that all of these expressions say the same thing, expressing discharge as a volume per unit time, such as cubic feet per second (cfs).
Think about how changes to the channel geometry or slope will affect discharge, remembering also the Manning Equation for velocity:
Velocity = v=(1.49/n) R2/3S1/2. If the slope changes, how will that affect discharge? If the depth of the channel changes, how will that affect discharge? Work through these problems numerically, plugging in example numbers until you begin to understand the pattern. Remember, in science, math is not just numbers--the numbers have real meaning in the world. Figure out what that meaning is!
When you are sure you understand, try the questions below to see if you really get it.
Application to a real-world problem in Fargo-Moorhead MN
There are a number of places where earth science problems cross paths with engineering problems, and the mathematical consideration of the influence of channel shape, channel slope, etc on discharge is one of those areas. After two one-hundred-year floods struck the Red River in Fargo-Moorhead Minnesota in just over a decade (1997 and 2009) people decided to look into building a diversion channel around the towns to protect them from future floods. This involved a complex political and engineering decision-making process, with farmers both upstream and downstream standing to lose due to greater flooding, and so opposing the project, and lower-lying Fargo on the west side of the river having a bigger vested interest than the somewhat higher-lying Moorhead on the east side of the river. We're going to look at only a single engineering consideration based on the discharge equations above.
This problem also provides an opportunity to consider good educational practice, both in that it uses understanding in one area of science to inform another and because it uses a real local problem to engage with broad conceptual ideas.
One of the national Next Generation Science Standards (2013) for middle school is the following engineering standard.
MS-ETS1-4. Develop a model to generate data for iterative testing and modification of a proposed object, tool, or process such that an optimal design can be achieved.
The equations above certainly provide some model constraints for optimizing discharge in a diversion channel. This kind of engineering thinking also bears on other standards such as the Minnesota state high school earth science standard below.
9E.2.2.1.3 Develop or use an algorithmic representation, based on investigations of causes and effects in complex Earth systems, to illustrate the relationships within some part of the Earth system and how human activity might affect those relationships. (P: 5, CC: 4, CI: ESS3, ETS2) Emphasis is on students identifying the interacting components of a system, mathematically modeling how those factors interact and accounting for the effects of human activity on the system. Examples may include local systems in which natural and human-influenced variables impact the amount of runoff.
Consider the two different diversion channel routes shown in the map below (in red and black). Based on the models above, which channel would move flood waters around the towns most quickly?
last updated 7/22/2023. Text and pictures are the property of Russ Colson, except as noted.