Problems_in Salt_Water_Incursion: Human_and_Climate_Effects
Earth Science Extras
by Russ Colson
Introduction
"Saltwater intrusion (SWI) into coastal aquifers is a growing problem for the drinking water supply of coastal communities worldwide, including for the sustainability of coastal ecosystems depending on freshwater inflow."---Saltwater intrusion into coastal aquifers in the contiguous United States — A systematic review of investigation approaches and monitoring networks by Jeeban Panthi, Soni M. Pradhanang, Annika Nolte, Thomas B. Boving, in Science of the Total Environment, v 836, Aug 2022. https://doi.org/10.1016/j.scitotenv.2022.155641
The excercises in this lesson are based in part on classroom activities outlined in Colson R. O and Colson M C (2017) The Importance of Teacher as Practitioner of Science in the Earth Science Classroom: An Example Considering the Water Cycle and Salt Water Incursion in South Florida, Florida Science Teacher, August 2017 issue, pg 12-16, Florida Association of Science Teachers.
These exercises address in part the following Minnesota State high school science standards for students:
- 9E.2.1.1.2 Analyze geoscience data to make a claim that one change to the Earth's surface can create feedbacks that cause changes to other Earth systems.
- 9E.2.2.1.3 Develop or use an algorithmic representation, based on investigations of causes and effects in complex Earth systems, to illustrate the relationships within some part of the Earth system and how human activity might affect those relationships.
- 9E.4.2.1.1 Compare, integrate and evaluate sources of information in order to determine how specific factors, including human activity, impact the groundwater system of a region.
They also address in part the following Minnesota preparation standards for Earth Science teachers:
- B7 (e) predict, in terms of direct and indirect, short-term and long-term effects, the probable impacts of a given environmental hazard on human society;
- B7 (g) predict, in terms of direct and indirect, short-term and long-term effects, the probable effects of a given human activity on an Earth system;
- B7 (i) explain, using words, diagrams, pictures, and maps, how observed changes in climate and sea level may have impacted the history of human development
- B7 (j) predict, in terms of changes in resource availability, production, population size and distribution, and current social structures, the probable impacts of future changes in climate or sea level on human society
Model-Based Prediction of Experimental Results of Ground Water Movement at a Marine Shoreline
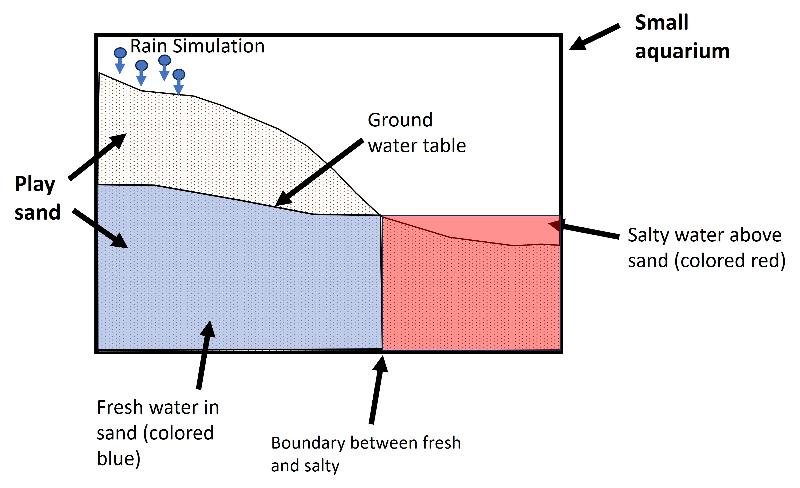
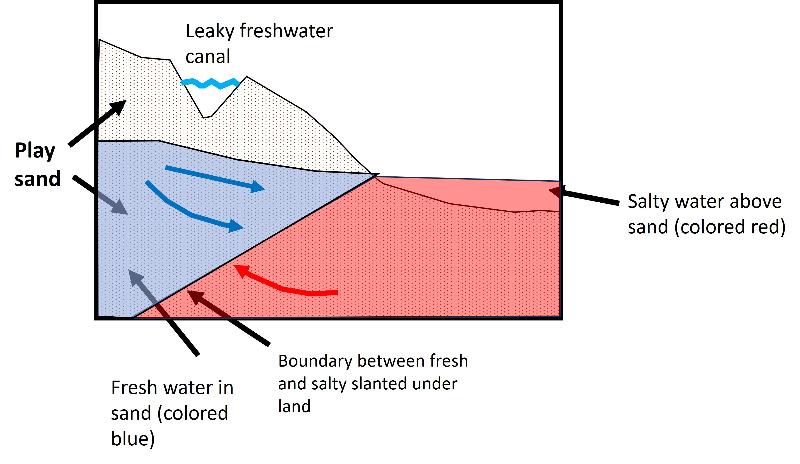
Based on your understanding of ground-water movement from earlier lessons in Earth Science Extras, such as Ground Water Hydrology , Porosity and Permeability Lab, and Problems in Pollutant Migration, and knowledge that salt water is denser than fresh water, predict how the salt-water--fresh-water interface in the simulation experiment shown below would change with time (recognizing that sand is permeable).

Suppose we add simulated rain to our experiment. Based on your understanding of permeabilty and groundwater movement from previous lessons, how do you expect adding rain change the outcome of experiment, relative to the changes inferred in the question above.
Now let's consider the situation where the sea level rises. How will this rise in sea level affect the incursion of sea water?
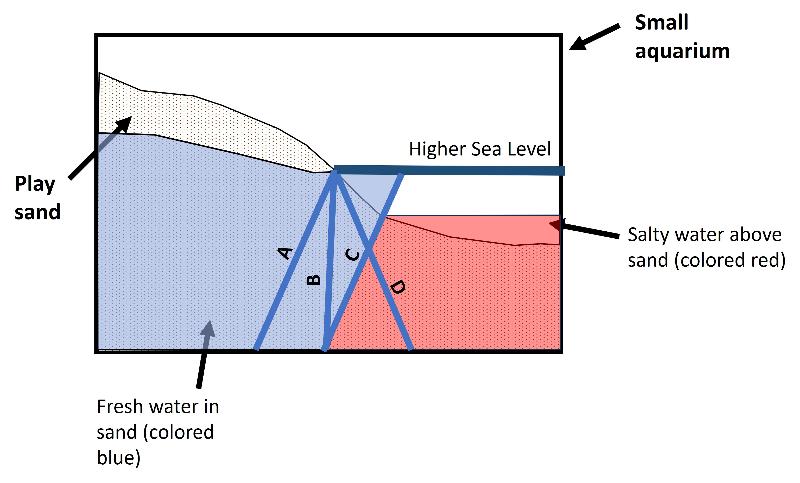
Think question: How will this shift with sea level rise affect the degree of salt water intrusion? (it might be expected to bring the salt water deeper into the land/fresh water)
Notice that the rise in sea level results in high water tables in the freshwater (because the "drain point" of the water table is higher which might also decreases the hydraulic gradient of the water table). Think question: what further influence might this increase in water table elevation have on salt water incursion?
(The higher water table might be expected to decrease how easily infiltration of rain water can flush out salt in the sediment/aquifer, thus having a second effect on salt water incursion.)
Now let's consider the effect of pumping groundwater from a well with the starting configuration below.
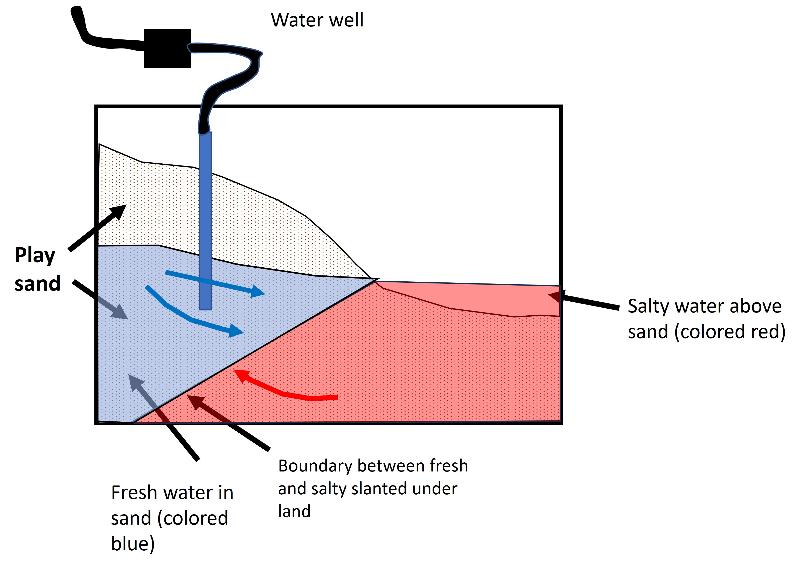
Think Question: So, the problem above considers how drawing from the well will affect the level of the freshwater table (creating a cone of depression). But how might it affect the boundary between fresh water and more saline water? Look at how the arrows indicate flow direction and postulate how the boundary might change.
Now lets consider a different situation where surface water is leaking INTO the groundwater from a leaky canal. How might it affect the hydraulic gradients and flow of groundwater in the vicinity of the leaky canal?
Reading and Interpreting Graphical Data:
The following graph for Miami-Dade County in Florida comes from Saltwater intrusion monitoring in Florida, by Scott T. Prinos, In Florida Scientist 79(4) 2016
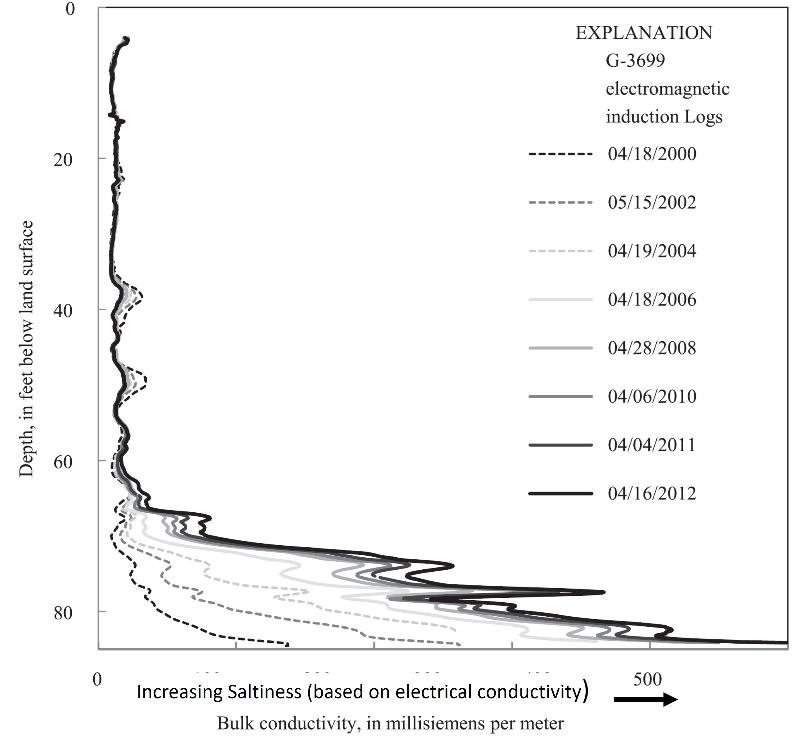
Think Question: Why might the salinity be greater, and the effects of salt-water incursion greater, at greater depth?
Think Quetion: Based on what we've done so far, how do you think drought might affect the degree of saltwater incursion? Think about how it might affect water table level or leaking from a canal.
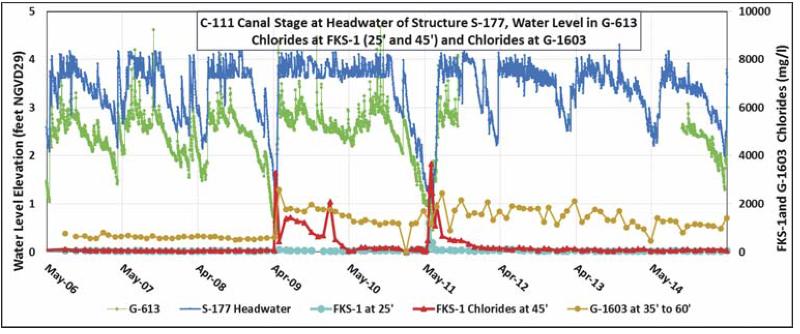
Below is a challenge from Rising Tides and Sinking Brines: Managing the Threat of Salt Water Intrusion, by Andrew W. McThenia, W. Kirk Martin, and Jolynn Reynolds in the August 2017 • Florida Water Resources Journal.
This graph shows water levels in two wells near a canal (well water levels in blue and green) and Chloride (an indicator of saltiness) in those two wells. Study this graph and then answer the question below. (like any graph-reading exercise, you will need to spend some time figuring out what the differently colored lines mean, and what the axis labels tell you, then looking for meaningful patterns in the data that you can connect to events in the real world)
Discussion Prompts:
Do some searching online to consider how sea level change has already influenced human societies. For example, you might check out how changes in sea level affected ancient populations the southern Tigris and Euphrates rivers. Or think about Venice, Italy. Or check out changes in harbor depth at Lulea, Sweden (which might be a case where rising sea level could benefit). To really get geological, check out the columns of Pozuoli, which Charles Lyell included as the frontispiece of his classic work Principles of Geology because of how it implied slow changes in sea level even during human times. To get more recent, consider how sea level change has affected people living very near to sea level in areas prone to hurricanes. Or something else. Be creative and do research online!
Last updated 3/21/2025. All text and pictures are the property of Russ Colson, except as noted.
.