Water Quality Exercises Part 2: Application of Water Quality Criteria to a Real-World Problem
Earth Science Extras
by Russ Colson
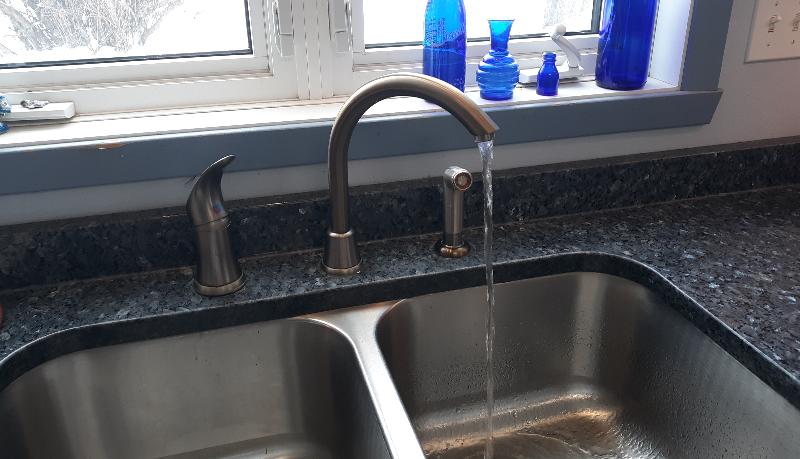
A lot of rural water around the world is still derived from ground water via wells, like in the case of the kitchen faucet in the picture above. This water might be filtered, or run through a water softener, or sometimes treated for bacteria, but is generally not given more complicated chemical treatment.
In this lesson you will:
We are going to look at a report of ground and surface water near the Clay County Landfill in Clay County, MN.
"2020 Annual Water Quality Report Clay County Sanitary Landfill, SW-34," prepared for the Clay County Solid Waste Department by Wenck Associates a part of Stantec Consulting Services Inc.
In the 1990s, an unlined cell of this landfill leaked and remediation efforts have been ongoing since then, resulting in many sample wells being installed around the landfill property (the cell that leaked was excavated, lined with impermeable material up to modern standards, and then the refuse returned to the landfill--the active cells are all lined as required by modern landfill regulations). The map below shows locations of wells, the location of the landfill (marked by the dashed lines around various Areas (I, II, IV, etc) that are filled during different phases of the landfills operation, residential wells in the area, a northern pasture, and a western wetland. Study the map to get yourself oriented.
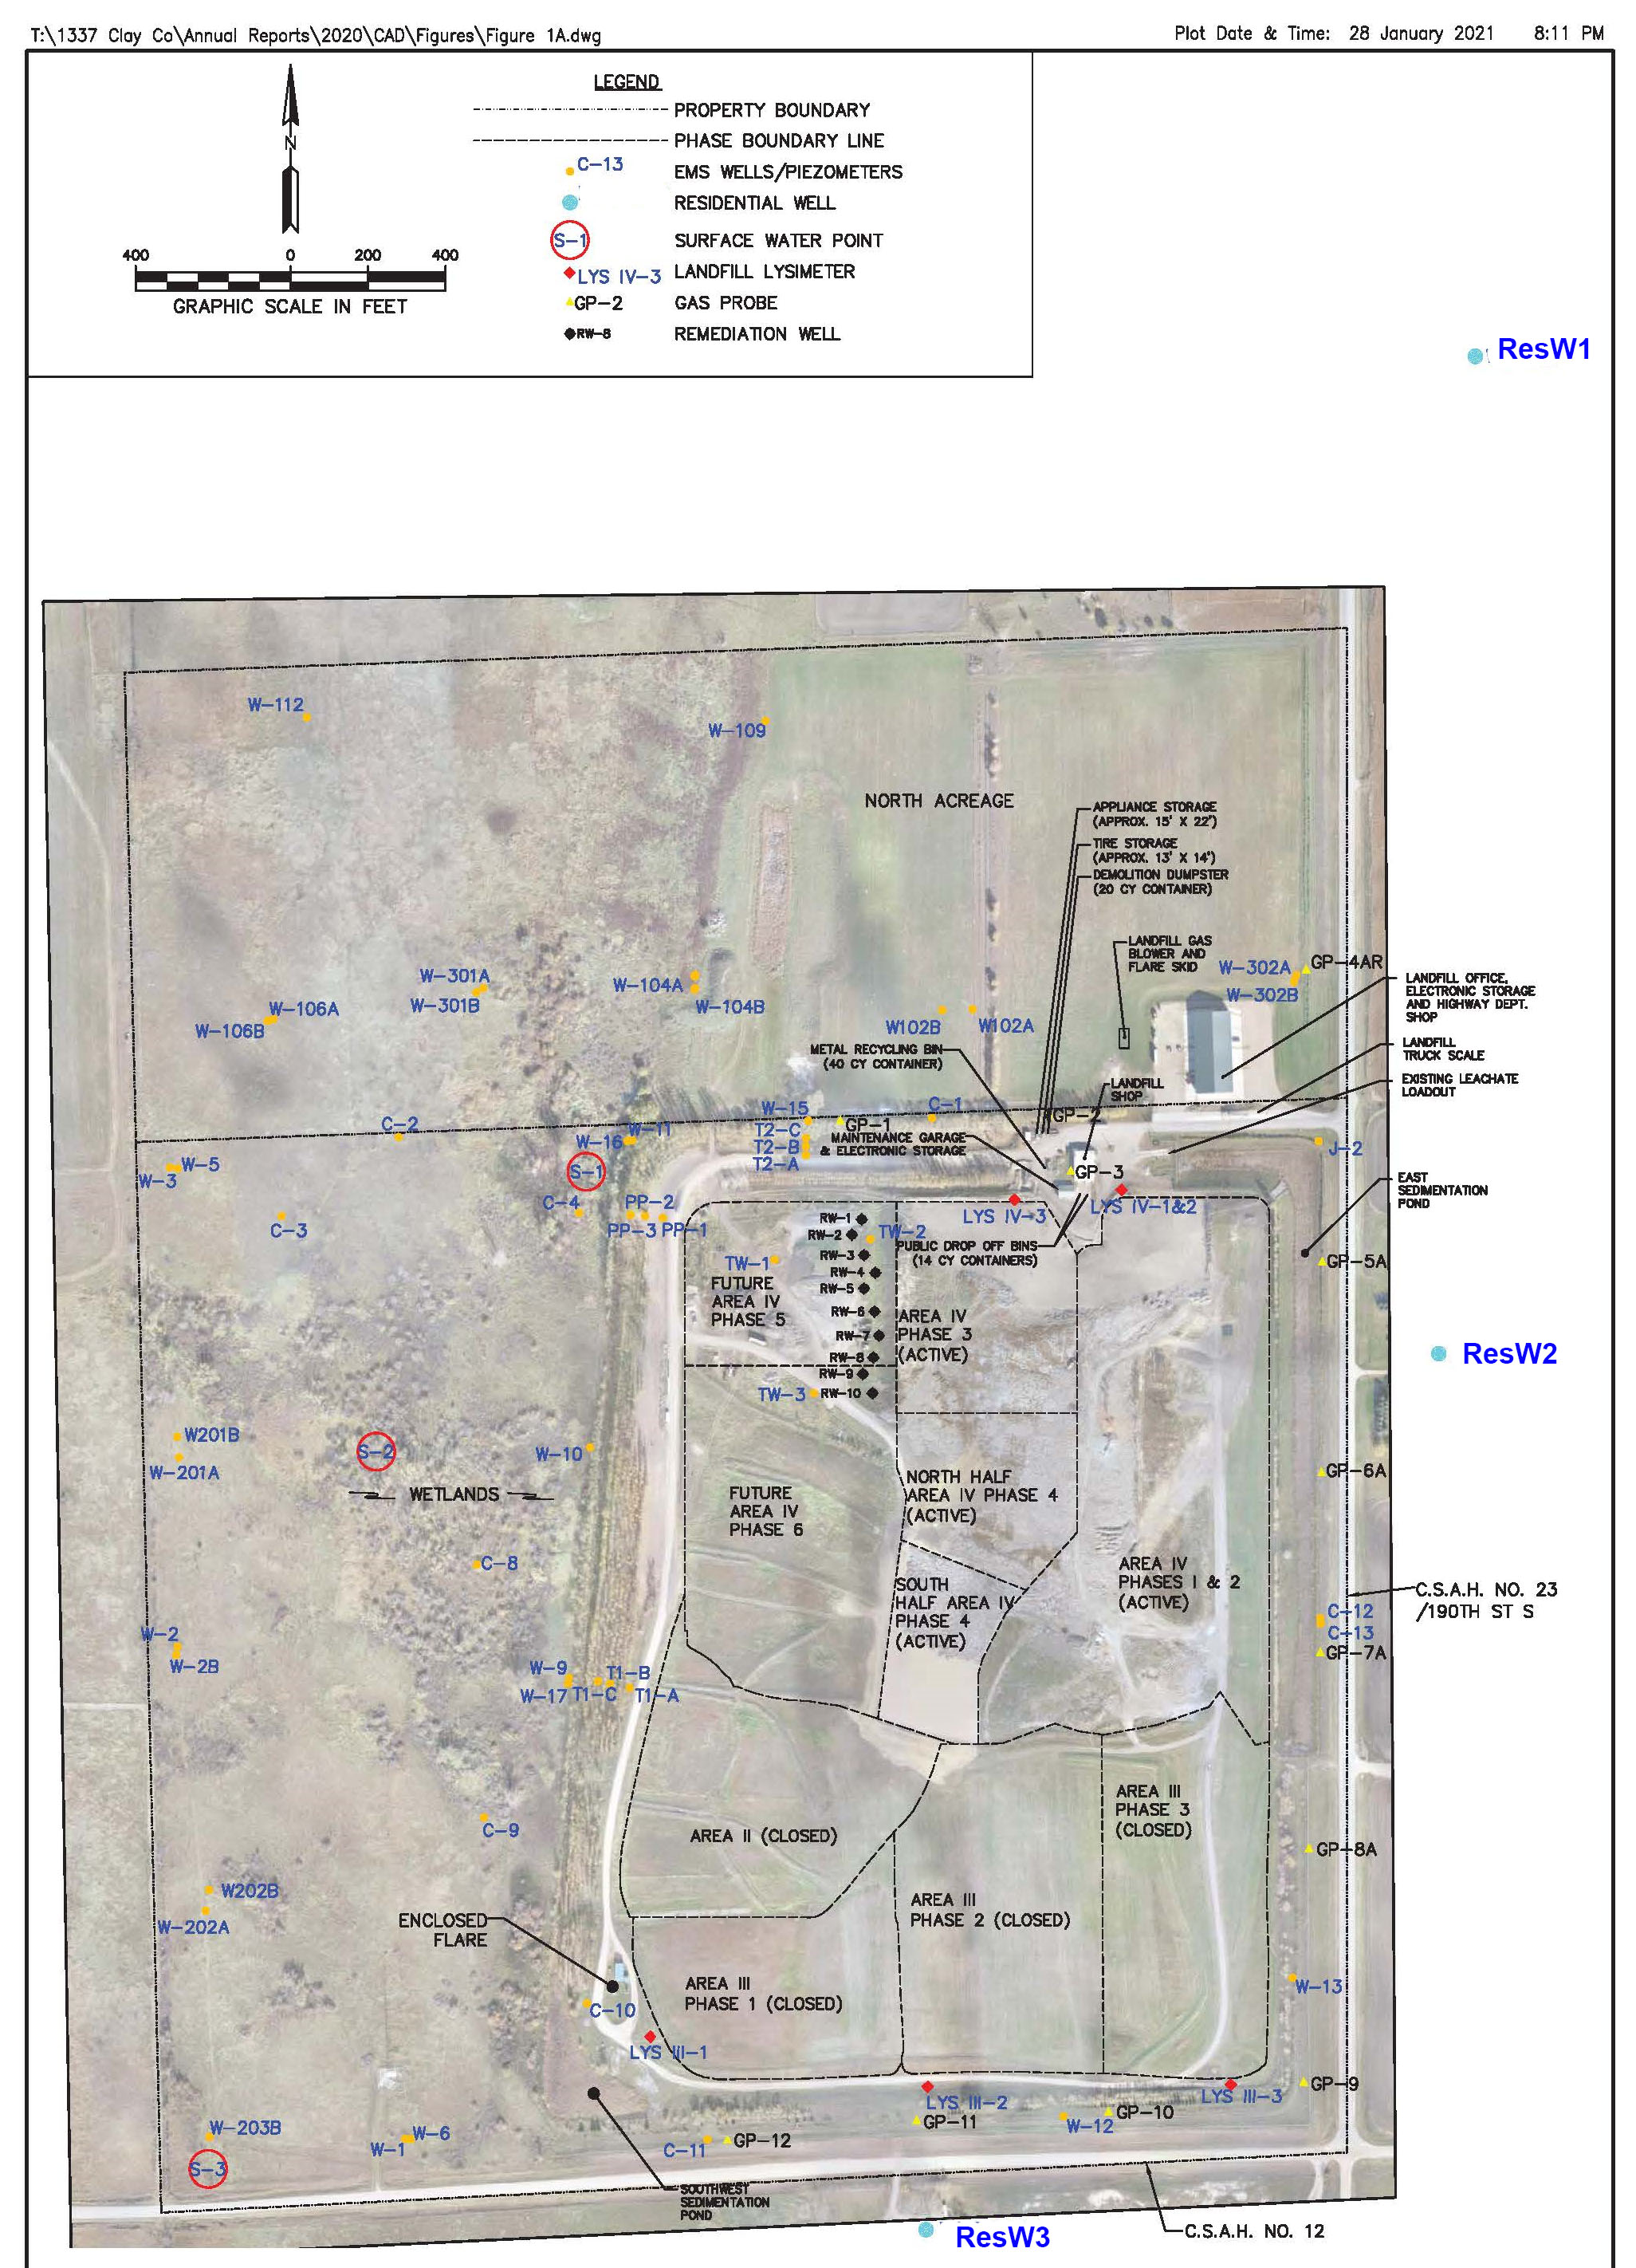
Below is a map that includes the elevations of the surface water table (there is also a lower aquifer at the landfill, which we aren't going to examine in this lesson). This map is for the water table in Spring of 2020.
The water table elevation is mapped using contour lines, much like one maps topographic contour lines to show elevation, except that these contours map the elevations of the water table, which in most cases is below the surface (coming to the surface in the wetlands to the west). Notice the water table elevations written on the contour green contour lines--these contour lines are based on water table measurements made in the arious wells, some of which are listed on the map. Familiarize yourself with the pattern of the contours relative to the landfill and the various detection and compliance wells for sampling groundwater.
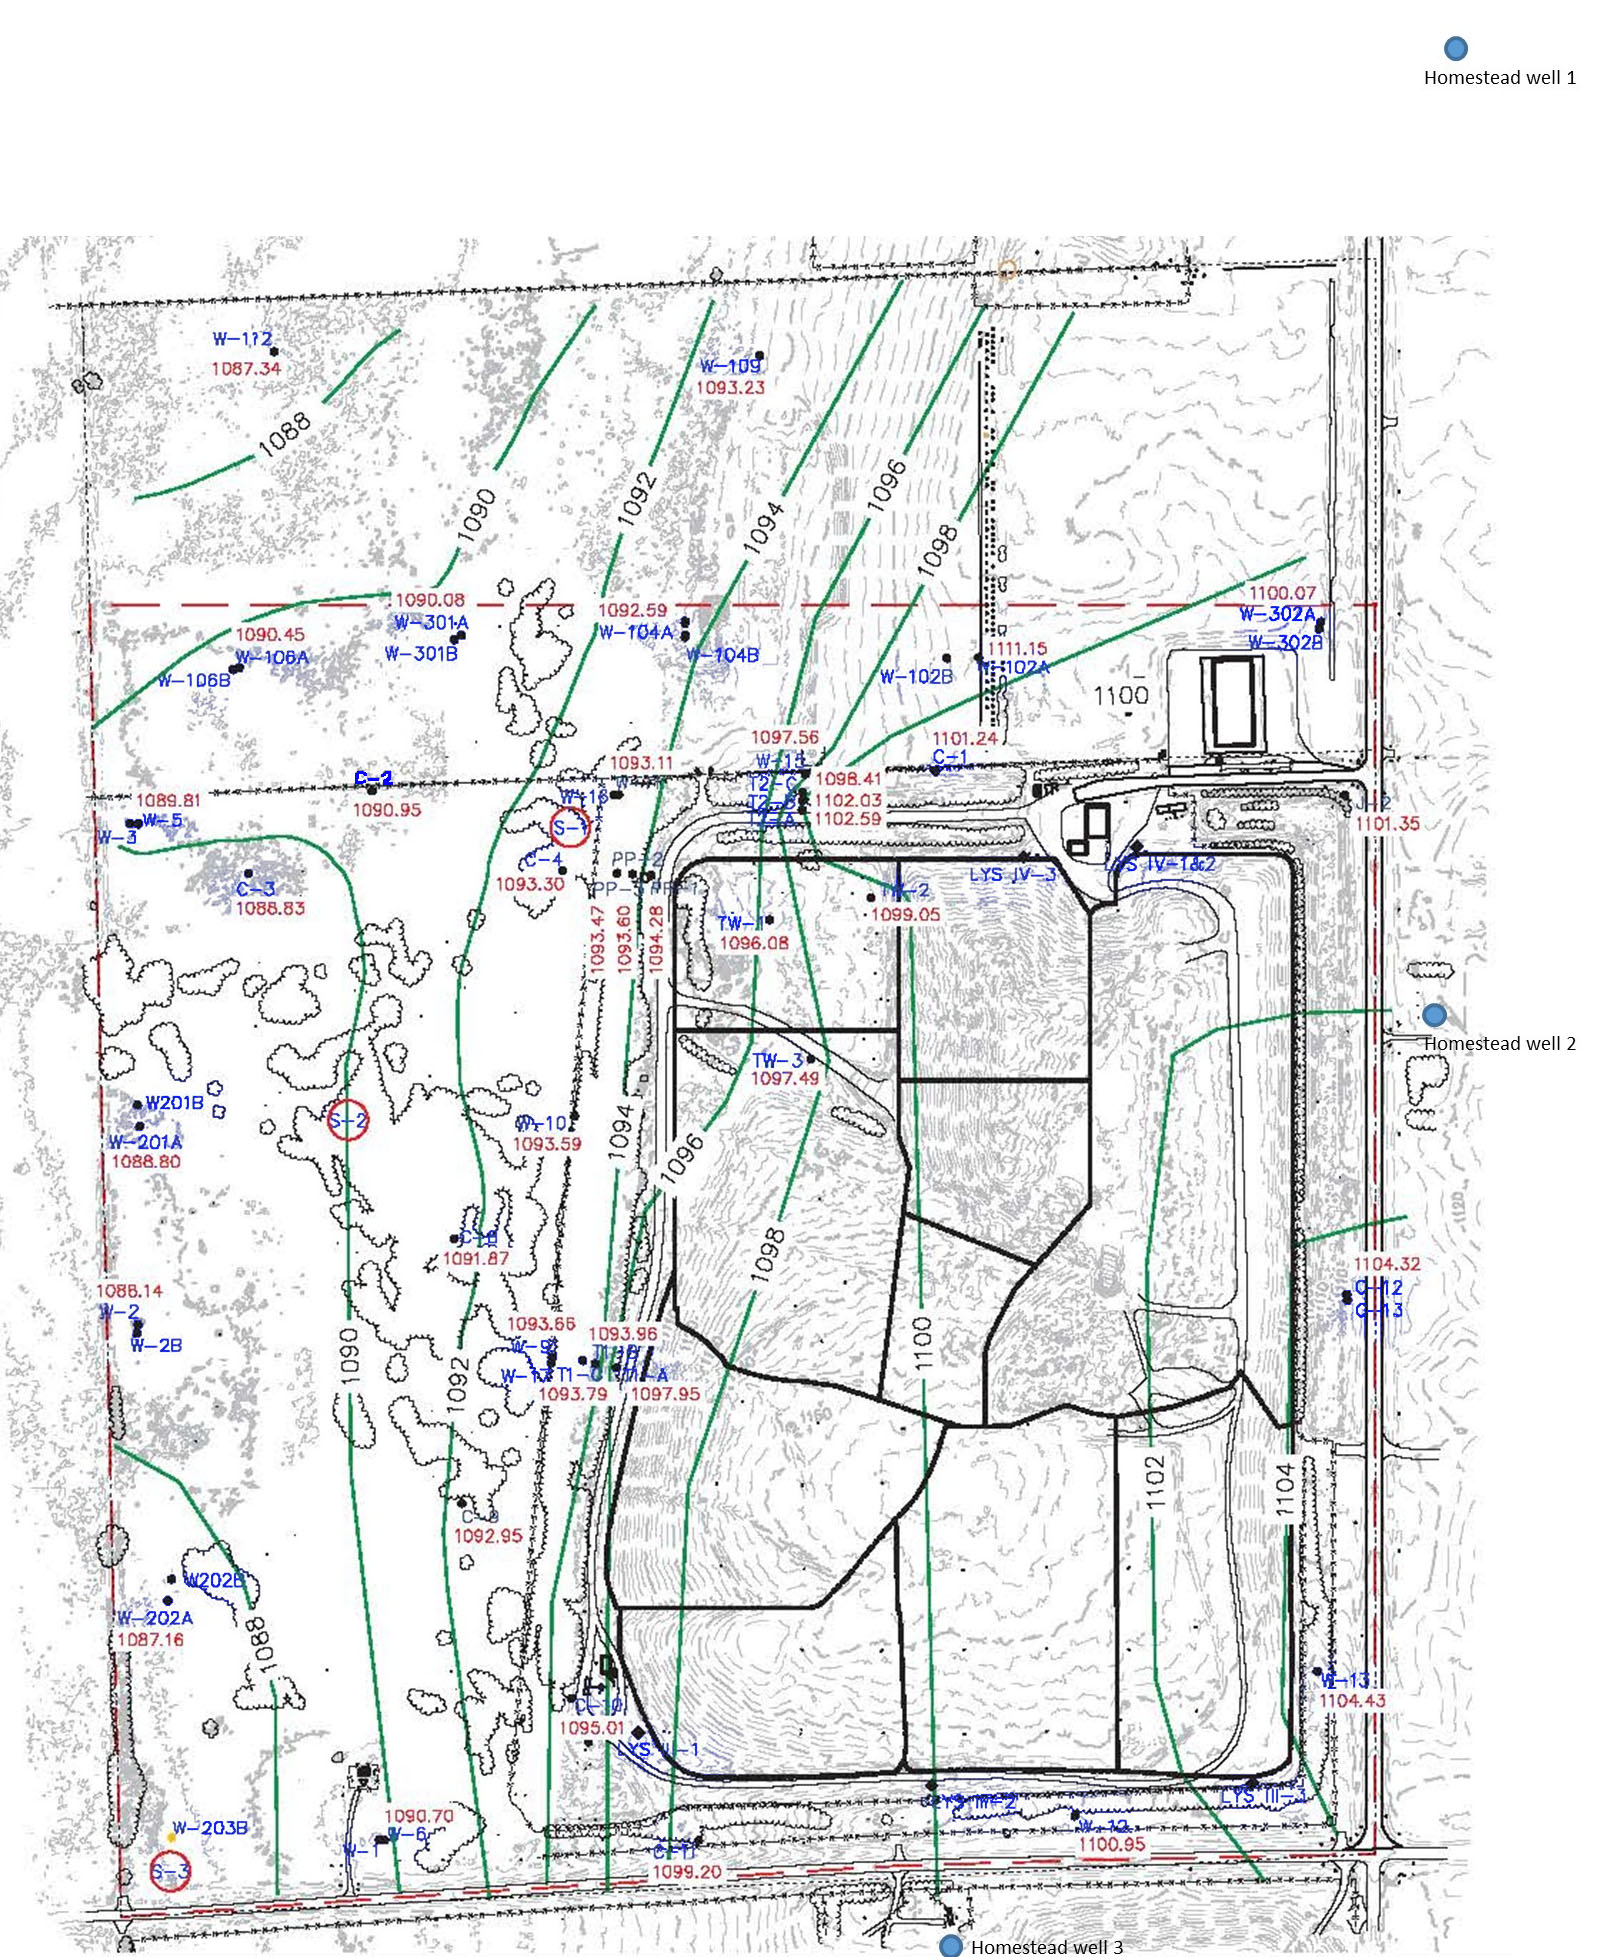
Just like water will tend to run downhill perpendicular to the direction of topographic contours, groundwater will tend to move toward lower hydraulic head, that is, toward lower water table elevations, perpendicular to the local contour lines.
Altough the report contains analyses of samples taken from many of the wells for many dates in 2020, the problems below are simplified so as to allow you to focus on smaller amounts of data. The data below are for a reduced subset of chemicals for only selected sampling dates for one surface sample location (that is, surface water was sampled, not well water) at location S-2.
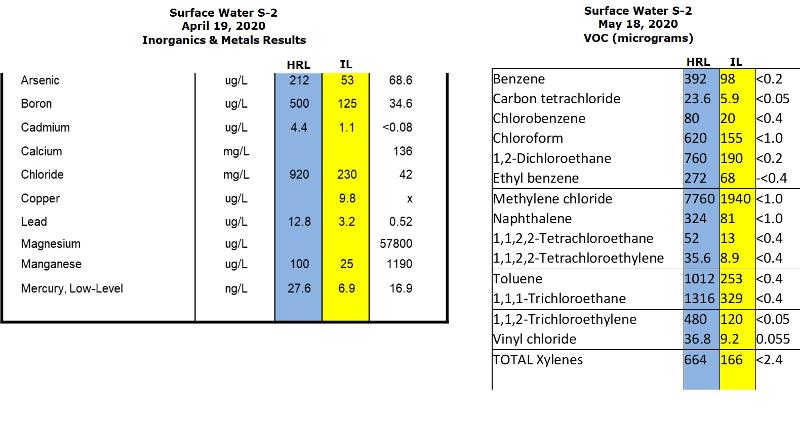
HRL stands for Health Risk Limit, standards developed by the Minnesota Department of Health (MDH) for contaminants based on Environmental Protection Agency (EPA) criteria, MCLs and risk-based exposure (remember that we learned in Part 1 of this lesson that states have to develop their own legally binding criteria based on the EPA criteria limits)
IL stands for Intervention Limit, a lower value that triggers extra consideration before a concentration reaches the maximum-allowed HRL.
VOC stands for Volatile Organic Compound (volatile means easily evaporated).
The units of concentration are provided in the tables.
The symbol "<" before a number means that the number represents a maximum based on the standard deviation of the analysis. Basically, none was detected within the limits of uncertainty of the measurement--so within uncertainty the value is zero, however, because of the uncertainty, the true value might be as high as the value indicated. This threshold is sometimes called the sensitivity of the analysis--the lowest concentration that can be detected by the analytical method.
So, for each of the contaminants shown, it might be that none was detected, that it was detected but was lower than the IL, it was detected at a value above the IL but less than the HRL, or it was detected above the HRL.
A big pile of data is not all that useful in assessing an environmental issue, or in communicating about that issue to the public or other interested parties. Rather, you—the environmental scientist—need to put the data into some form that can be understood and evaluated such as a graph or a map. For example, suppose that you want to evaluate whether the toxicants that are detected have their source in the landfill or if they are background pollutants present naturally in the environment, or perhaps they are originating at some other location. Tables and tables of data for dozens of wells is hard to evaluate unless you are a computer system, which most of us, as of this writing, are not. Therefore it's often necessary to go through each well individually, evaluate it, and then find some way to illustrate the data in a map view that facilitates understanding (facilitation of the portrayal of spatially-correlated data is one of the key contributions of geospatial information systems--GIS). I'm going to do most of this for you, but to get an idea of the process, consider the exercises below.
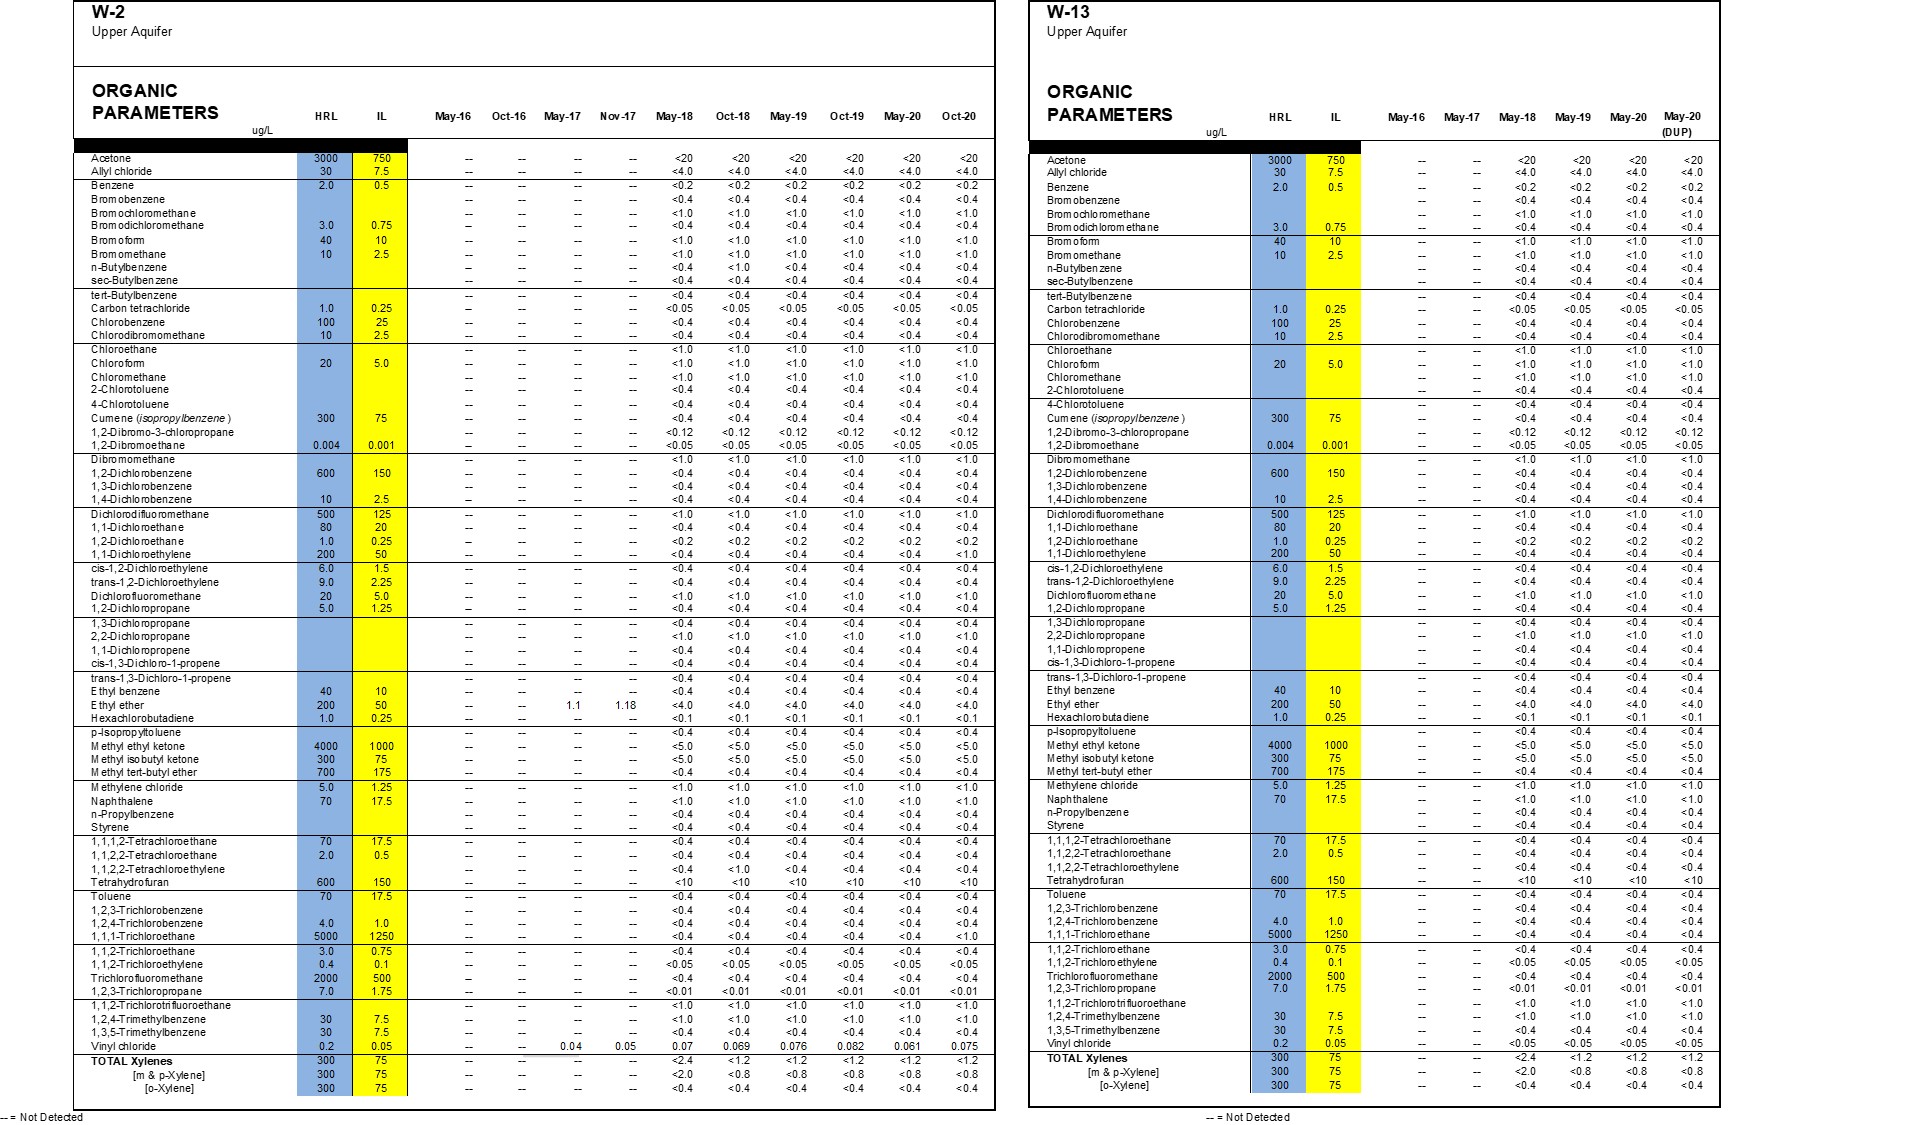
Simple presence of VOCs (Volatile Organic Compounds) nor non-presence is important because these compounds are not naturally occuring and so are likely to come from the landfill. Below are two of the organic compound data tables from the report with all analyzed VOCs shown.
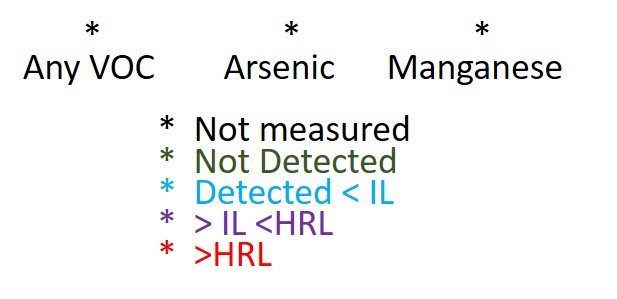
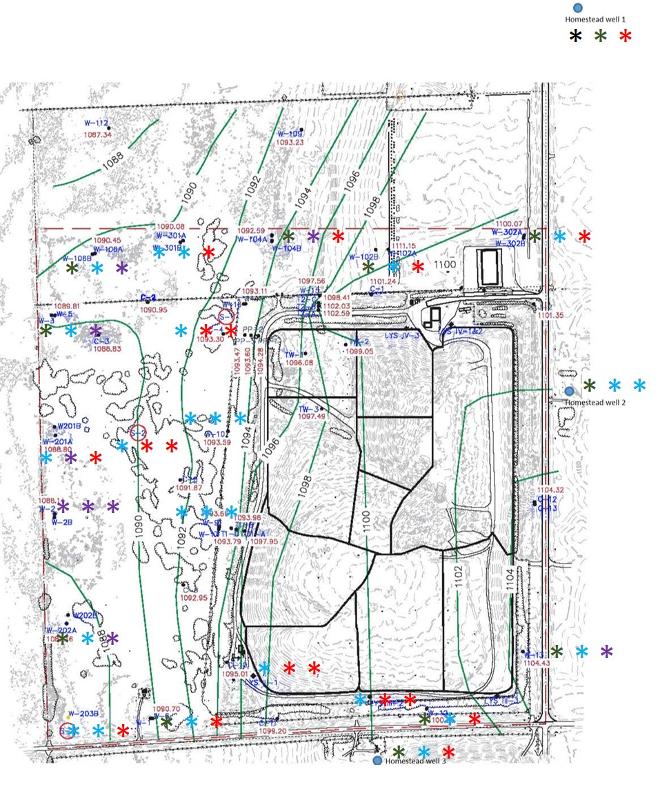
I have gone through all the data in the report for you, and in the map below I use askerisks to indicate the levels of detection for VOCs (any VOC), aresenic, and manganese. For each of several sample locations I show three asterisks, the first referring to VOCs, the second to arsenic, and the third to manganese. The asterisks are color coded according the the level of detection as per the map key below.
Study the pattern of the map, thinking about the levels of detection, the direction of groundwater flow, and possible sources of contaminants.
Consider the data below for Well C-11 (you will need to find that well's location on the south edge of the maps above in order to address the following question).
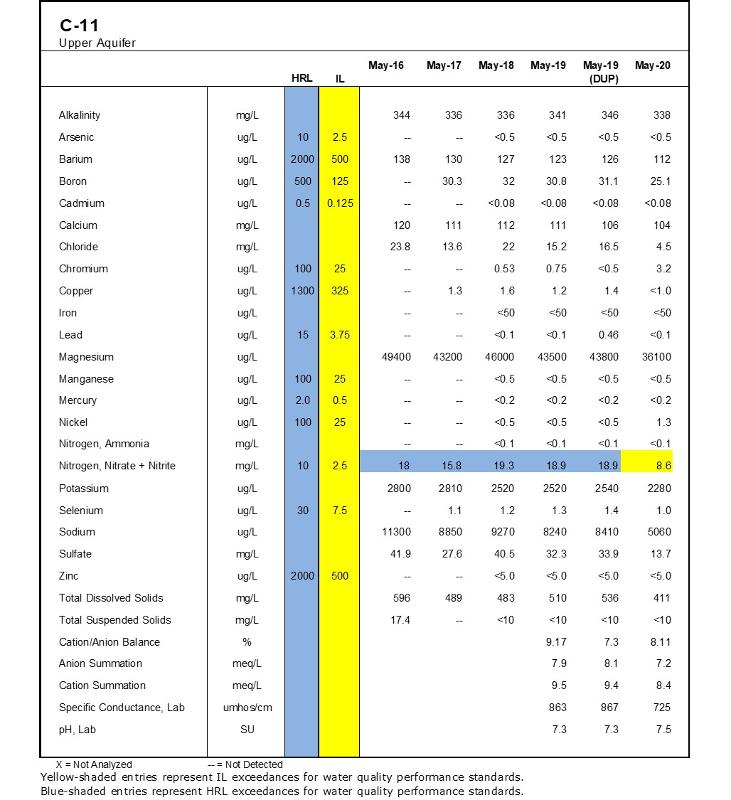
Notice that there is HRL and IL exceedence of nitrates, a common occurence in wells in agricultural areas. After finding the well on the maps above, and thinking about groundwater movement to or from this well, answer the following question.
For the next question, you will need to open the Drinking Water Criteria Table from Part 1 of this lesson:
National Primary Drinking Water Regulations _ US EPA-captured 3-3-2022
Compare the HRL value for Arsenic in the table for Well C-11 to the HRL for Arsenic in the table for sample site S-2 earlier in this lesson. Did you notice that they are quite different? The value listed for site S-2 is more than 20 times higher! Is this a mistake? An effort to fudge the data so as to not exceed allowable limits? Rememering what we learned in Part 1 of this lesson, what is different about these two samples that might explain the difference in their HRL values? Think about it for a while. The answer is at the bottom of this lesson *.
Note: We have talked about 'background' concentrations for contaminants, referring to concentrations existing in the environment that are not related to a particular source of a pollutant. We might also talk about 'historial' concentratons, the concentrations that existed prior to human alteration to the environment. Comparing present concentrations to historical concentrations would give us a much better idea of the effect of human activities on the environment, but, needless to say, historical concentrations are often hard to come by, so we often have to rely on our estimates of background concentrations.
*surface water (site S-2) falls under the Clean Water Act and uses the aquatic life criteria table while ground water (Well C-11) falls under the Safe Drinking Water Act and uses the Drinking Water criteria table.
last updated 3/9/2022. Text and pictures are the property of Russ Colson, except for text and data from the US EPA, and the Clay Country Landfill Report owned by Clay County and written by Wenck Associates.