Topographic Map Construction and Reading
Earth Science Extras
by Russ Colson

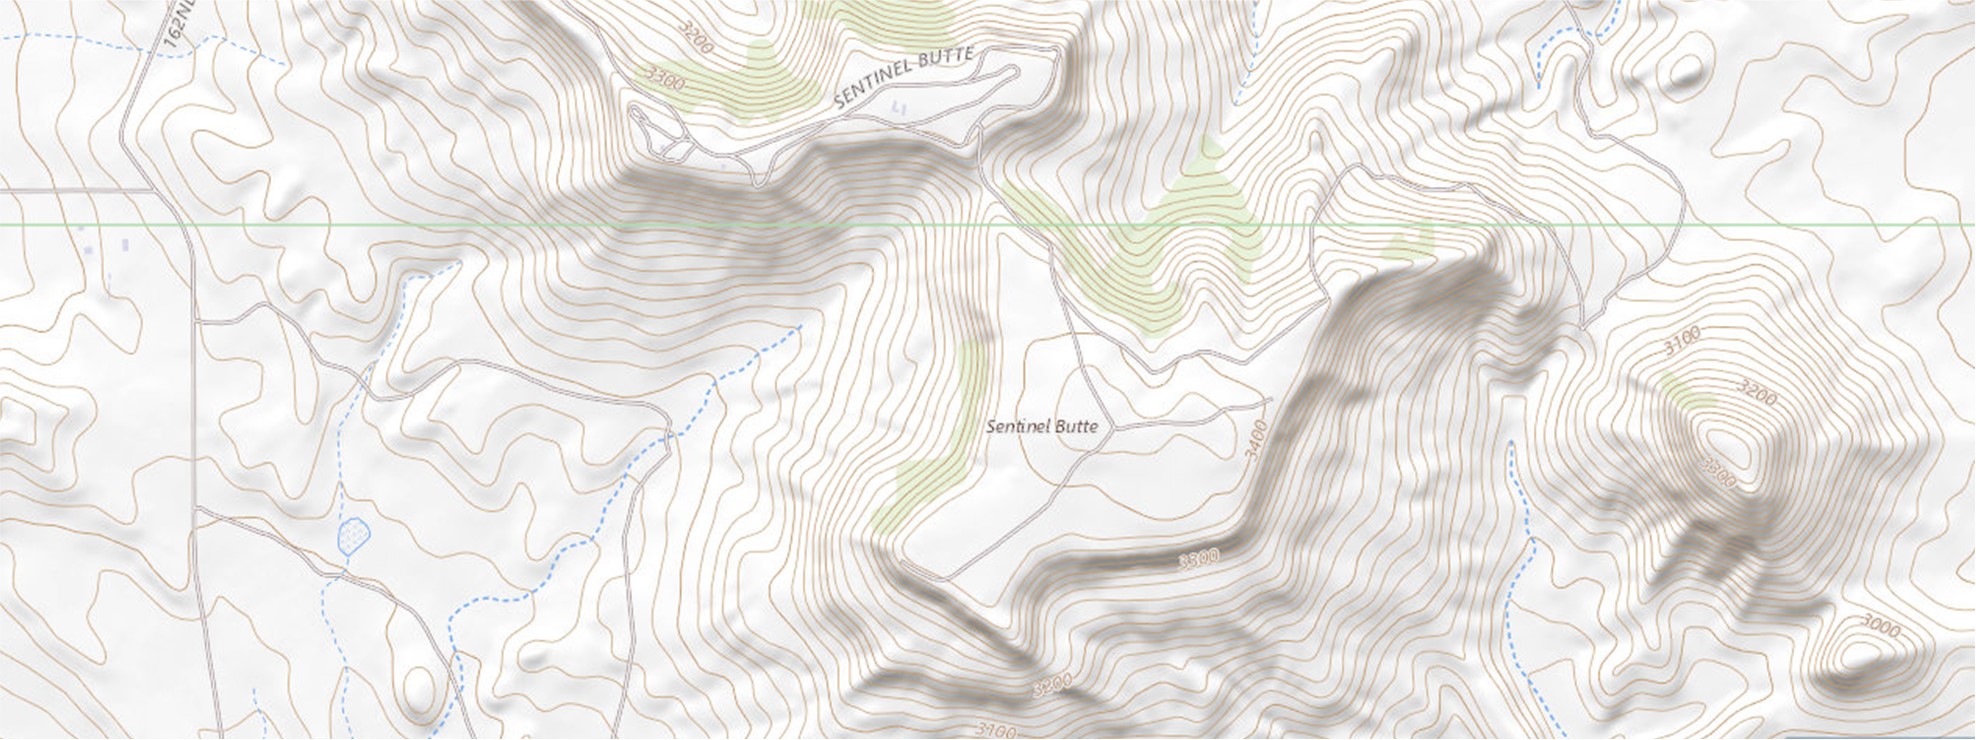
USGS topo map (with shaded relief) of Sentinel Butte ND. Note the flat top to the butte and the steep sides, as indicated by the topographic lines.
Topographic maps are a subset of a larger, inportant group of maps called contour maps. Contour maps use curves drawn on the map (contour lines) to plot a third dimension of data onto a two-dimensional map. For example, topographic maps plot elevation contours, barometric maps plot pressure contours, temperature maps plot temperature contours, and so on.
Each contour line represents the set of points where the third dimensional data has a single value. For example, the 500-foot contour line for a topographic map connects points that have an elevation of 500 feet.
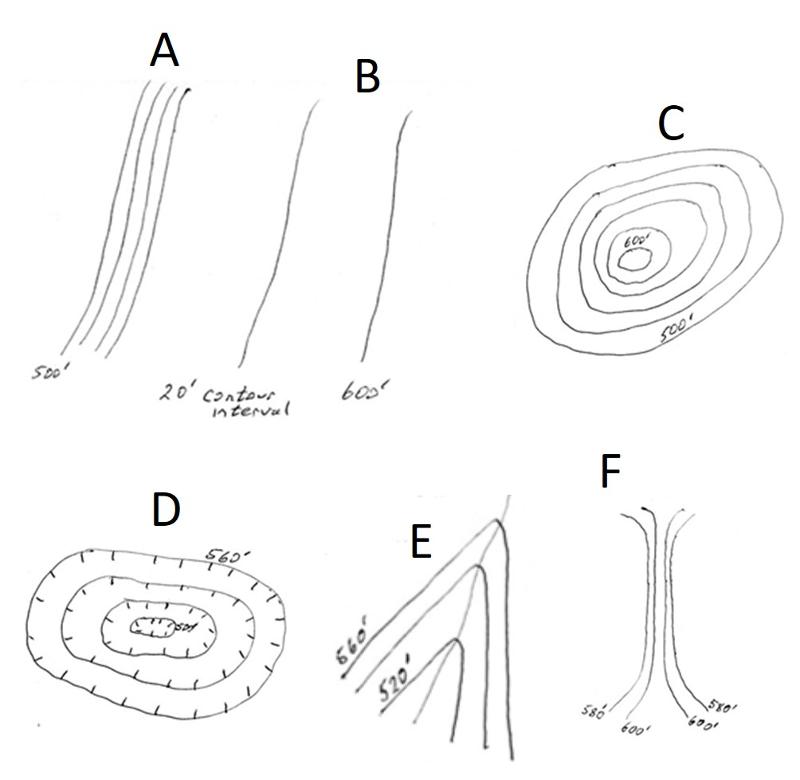
Each contour map has a contour interval that governs the spacing of the contour lines. For example, a topographic map with a 20-foot contour interval would have a curve for 500 feet, another for 520 feet and so on. Because each contour line represents a different elevation, contour lines of different elevation cannot cross each other. The pattern of the topographic contour lines portrays a variety of different landforms.
By looking at a contour map, one can quickly assess how the third-dimensional data is changing with location. For example, topographic lines reveal where there are hills, rivers, cliffs, plains, and so on.
Consider the topographic map patterns shown below.
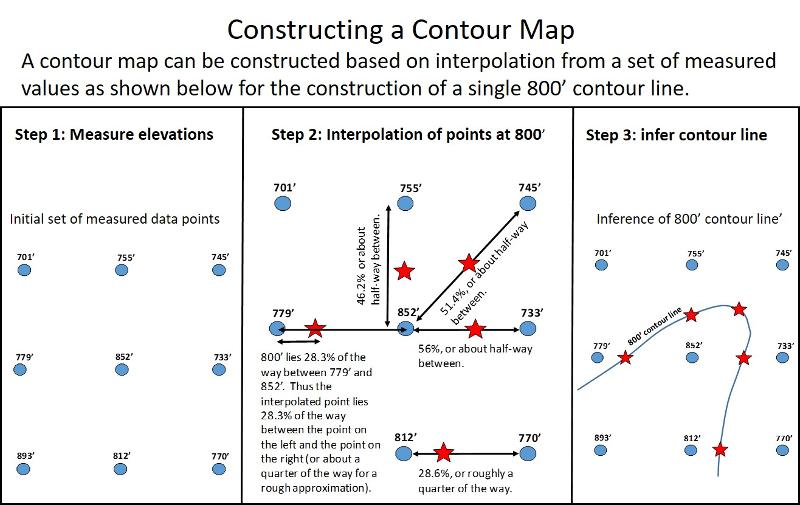
Contour mapping begins with real data—measurements of values at a select number of locations. To create a contour map from a limited set of measurements, it is necessary to interpolate values between the measured locations. This concept is illustrated below. Study the illustration and then try your hand at a simple contouring exercise below.
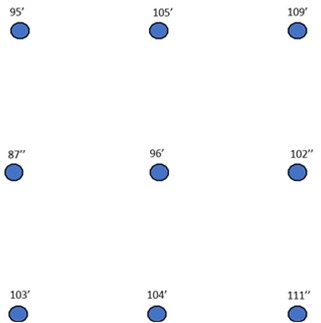
Simple Contouring Practice Exercise:
To practice the idea illustrated above, print out the small map below and draw a 100-foot contour line(s) given the map elevation data. Once you have done this, check your results against the multiple choice question farther below.
Click here when you are ready to check your result against the multiple choice question
Consider the topographic lines below.
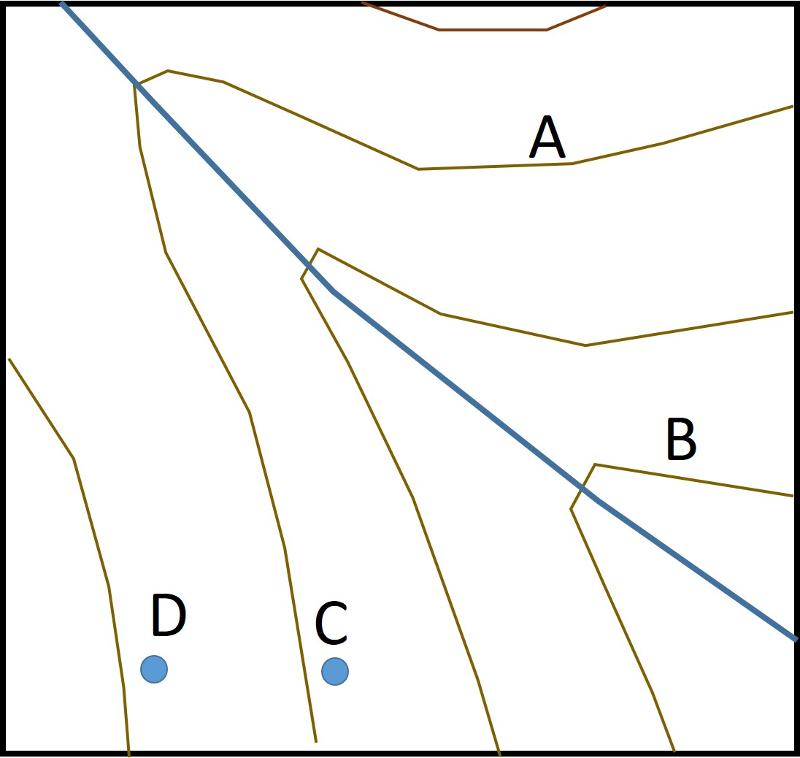
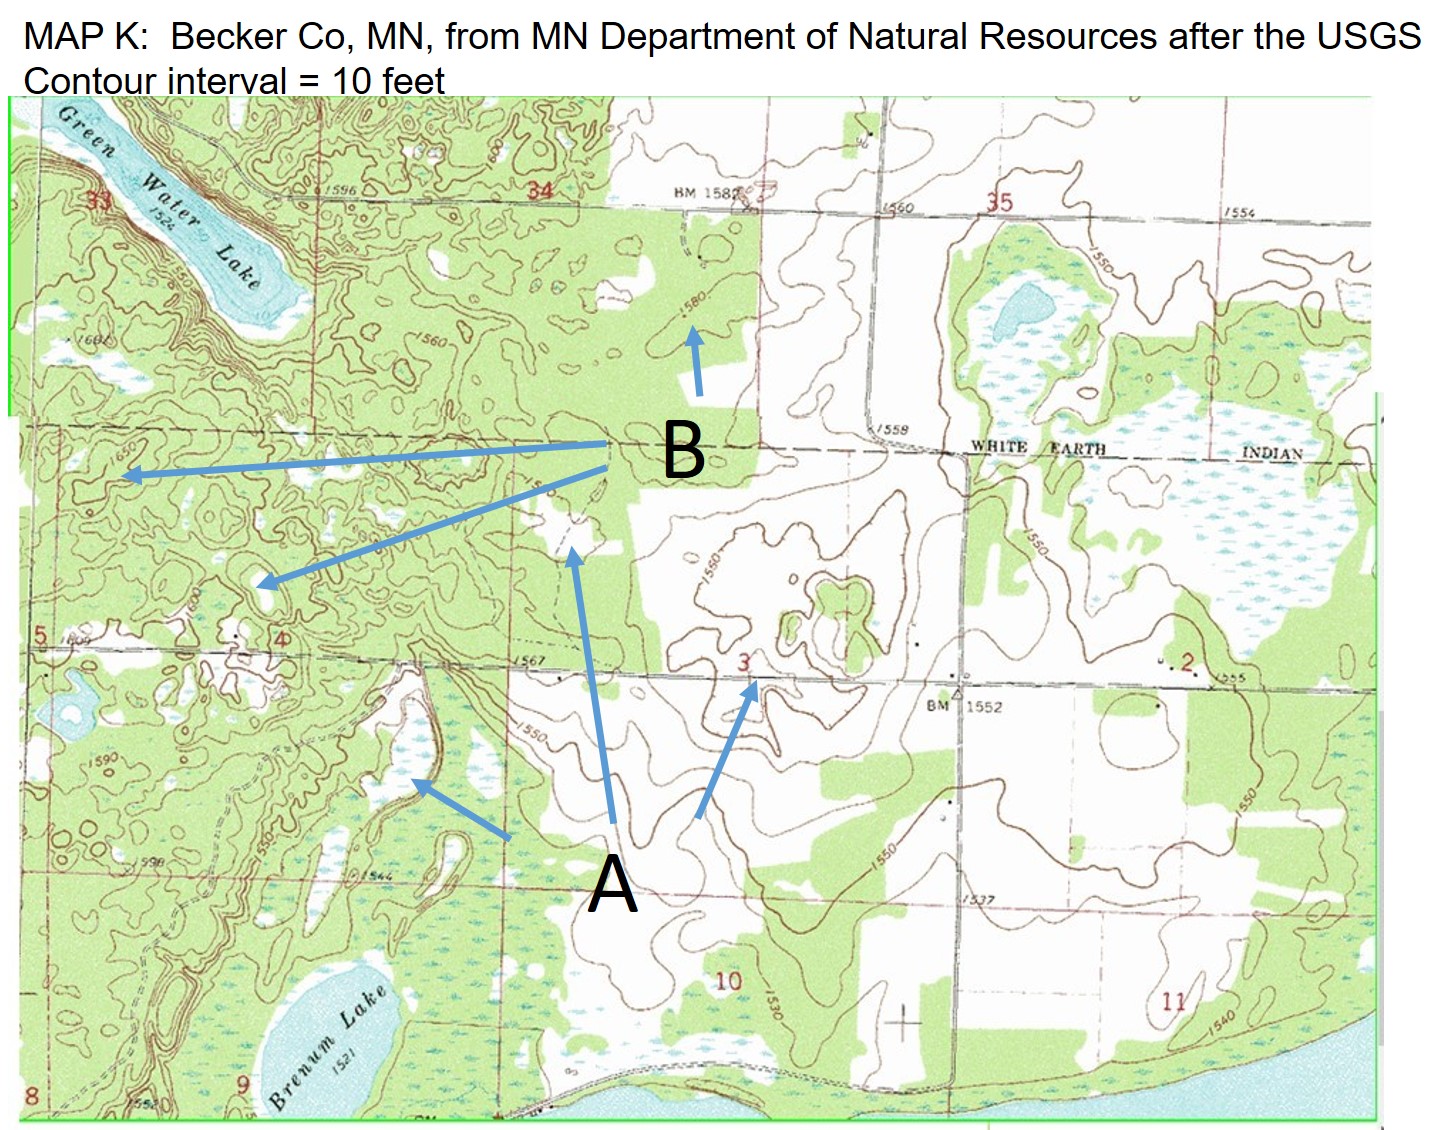
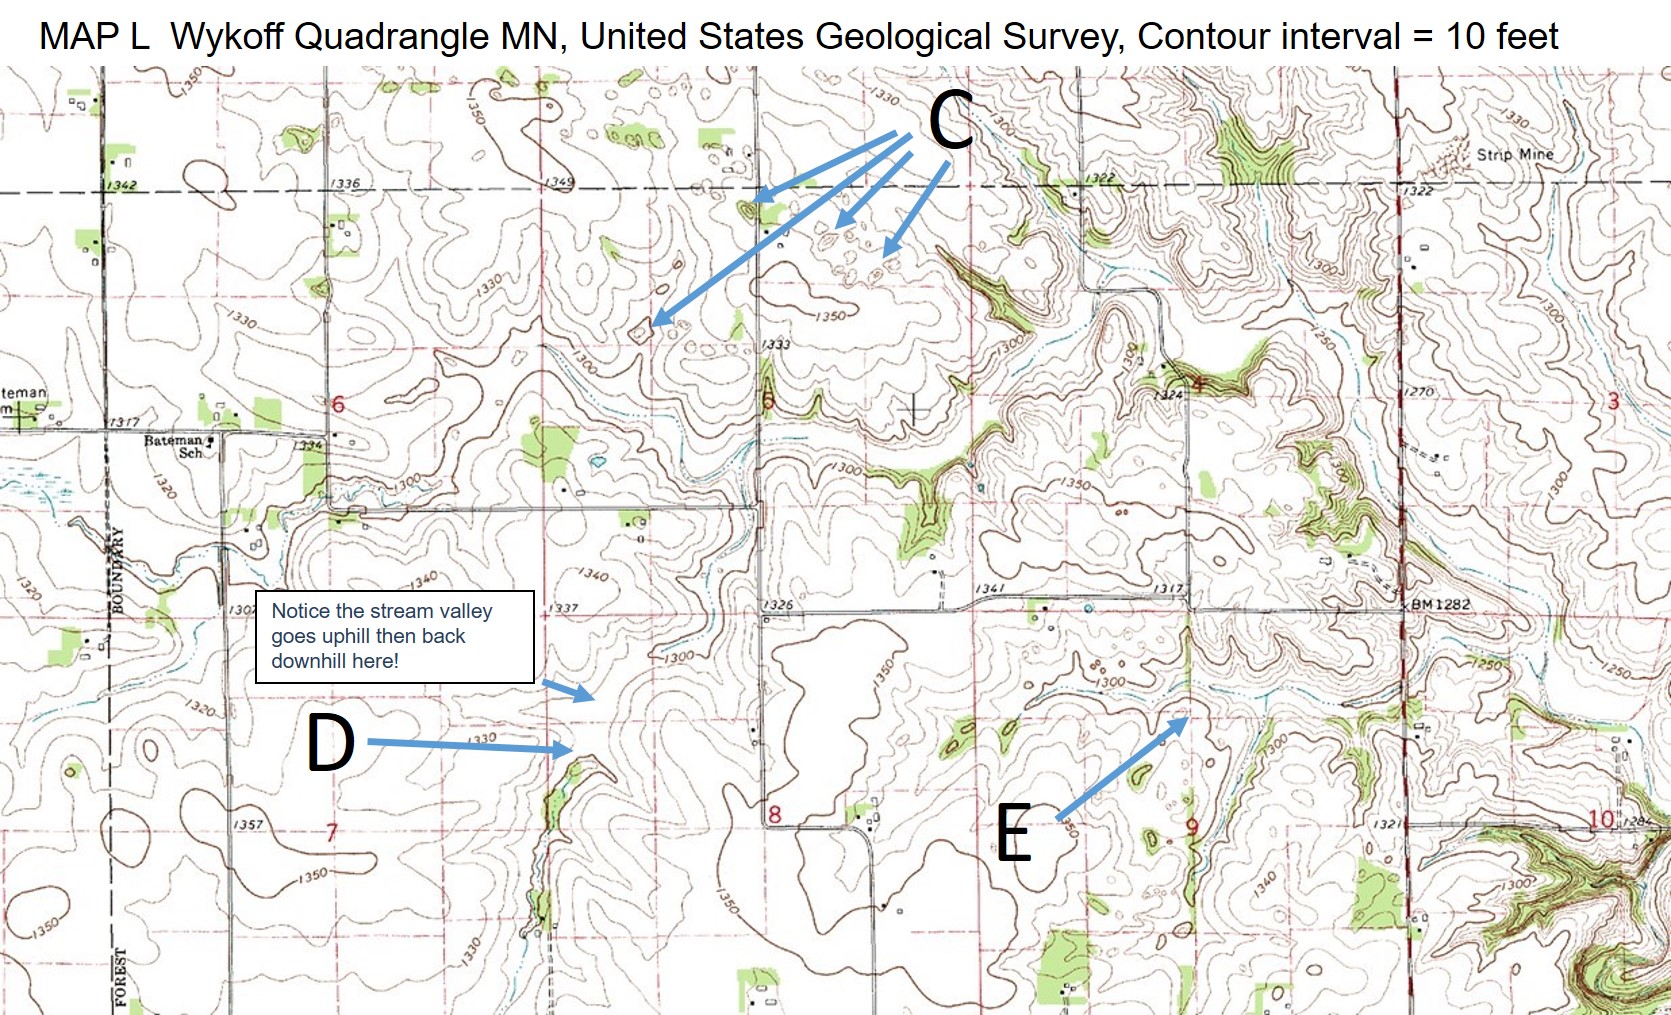
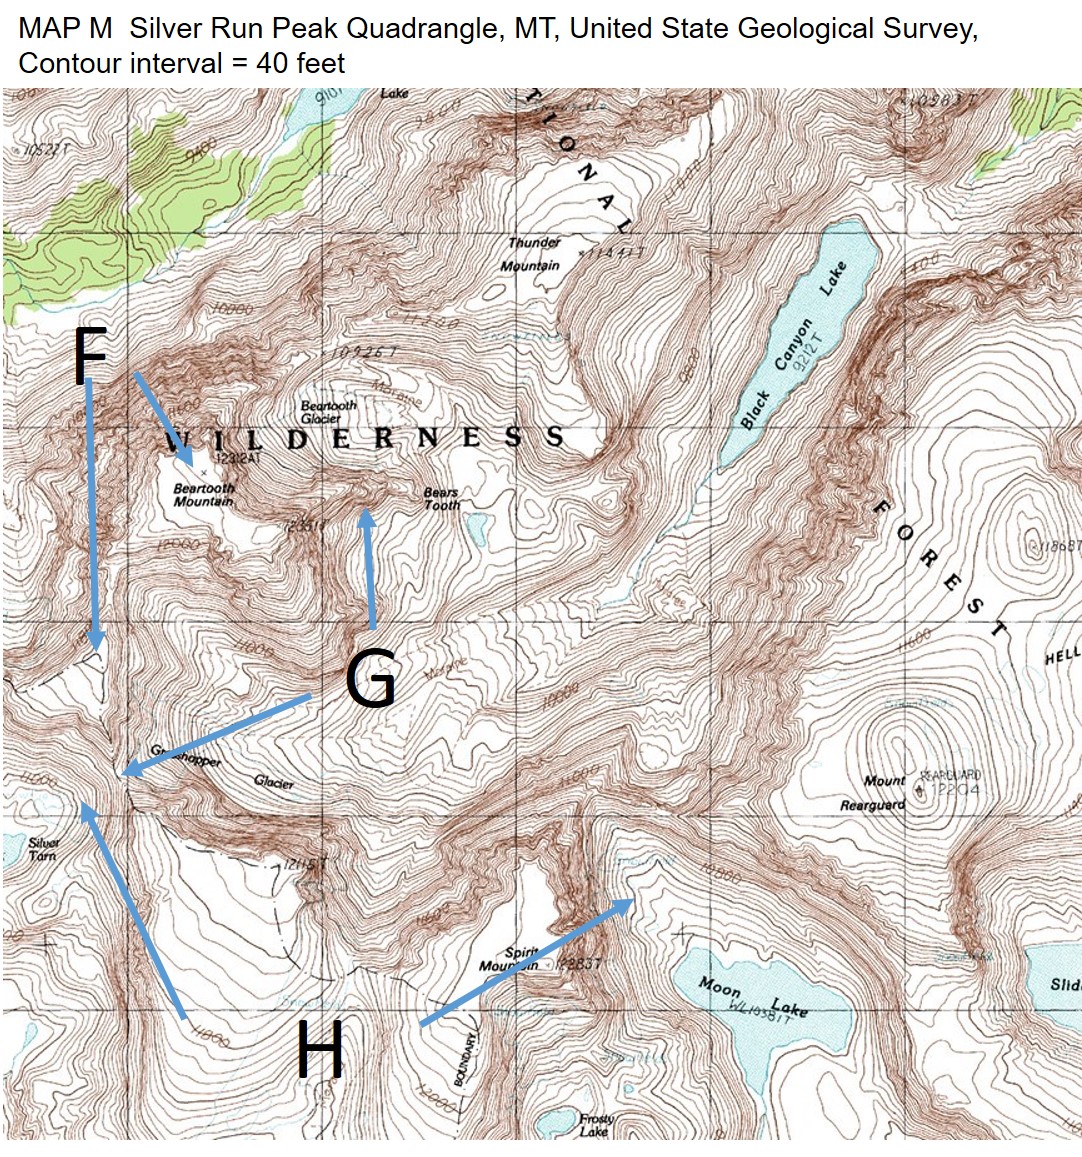
For the GIANT matching problem below, you might first make sure that you understand the meaning of the following landscape terms: dendrentic drainage, sinkhole, arête, horn, cirque, tarn, vanishing stream, drainage divide. If there are any of these that you don't know, then look them up!
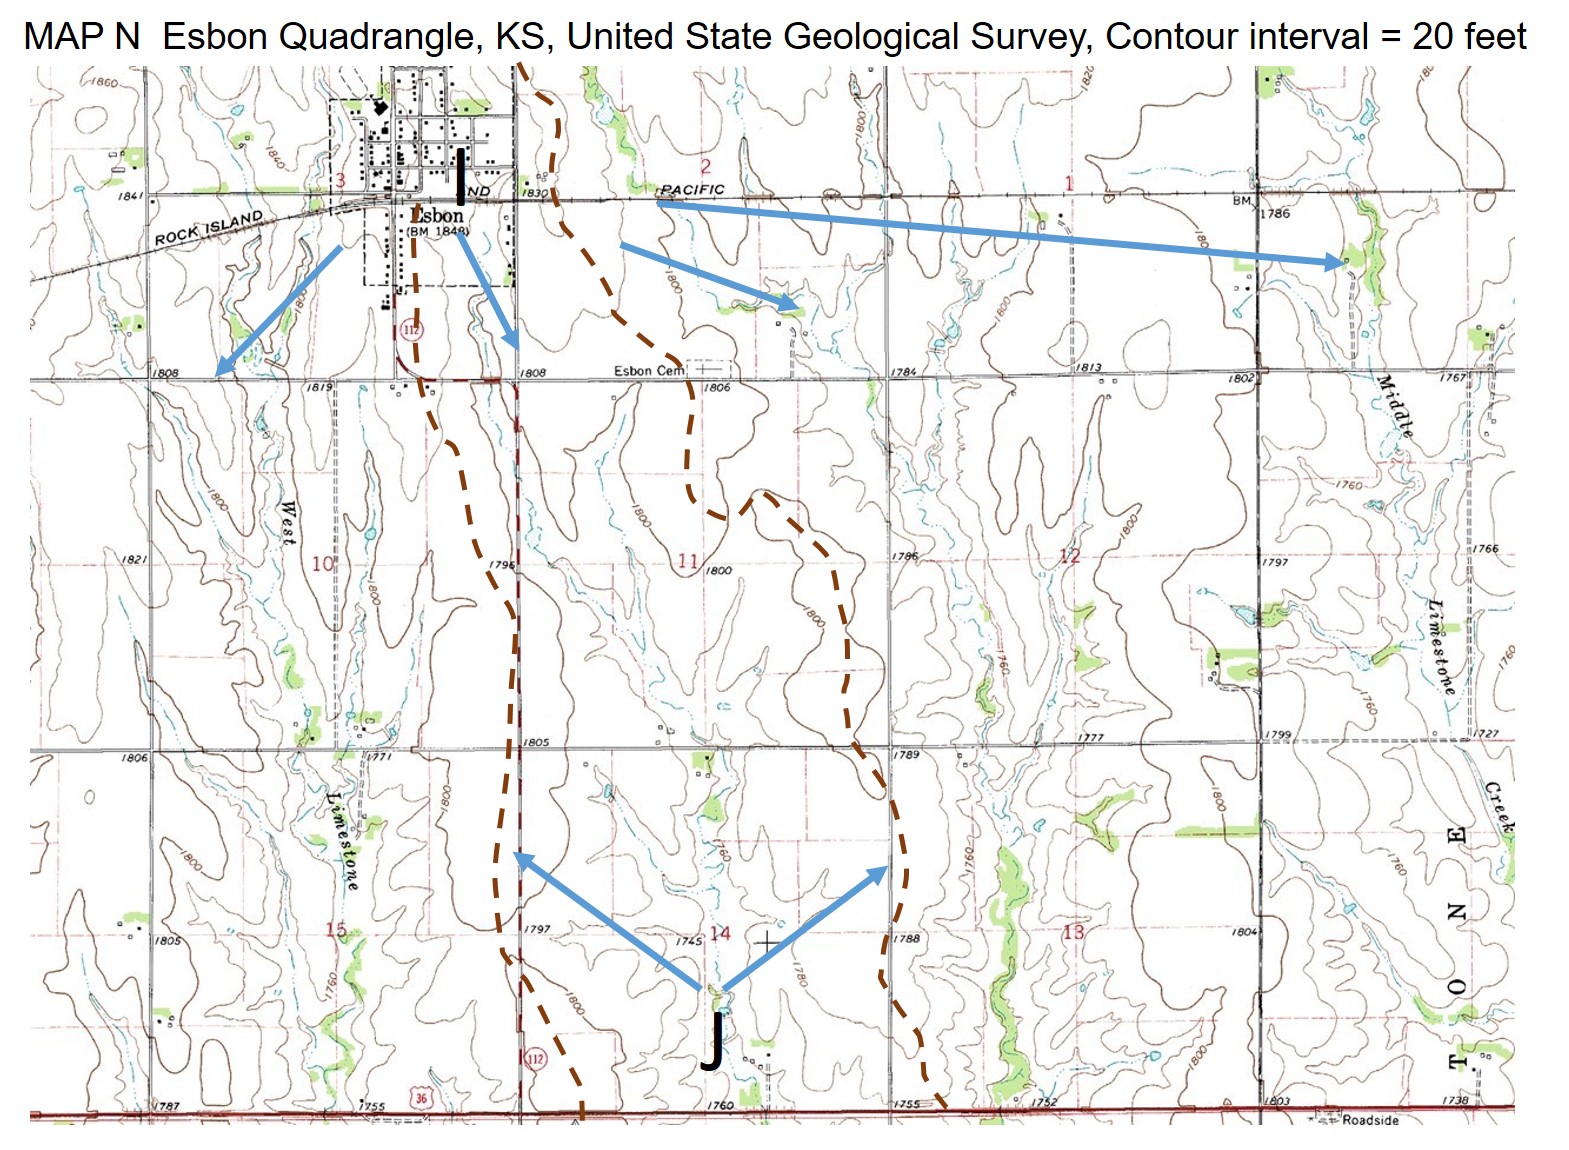
Consider each of the four maps below, with particular features identified. Based on the topographic expression of each feature, you identify it from the giant list of matching options in the question below. NOTE: This question as 14 different parts--so it's like 14 questions all in one. Take your time answering this question!! Jot down notes on a separate sheet of paper if it helps you keep track.
last updated 8/17/2022. Text and pictures are the property of Russ Colson, except for topo maps from the USGS.