Earth Science Extras
by Russ Colson
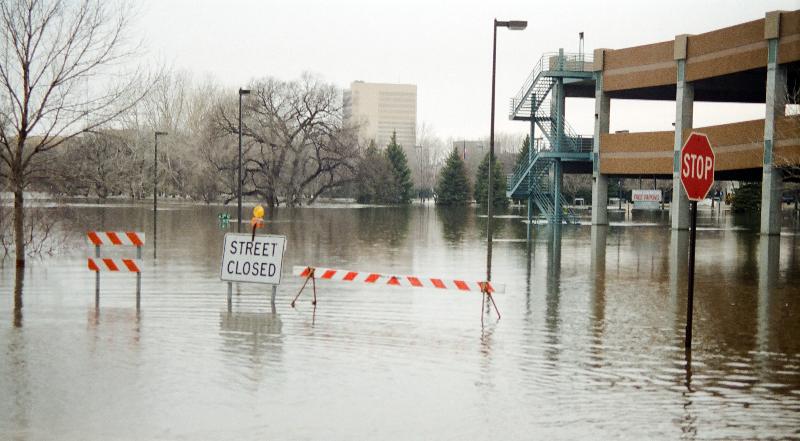
At 28800 cubic feet per second at the crest in Fargo ND, the flood of 1997 on the Red River was, at the time, the largest flood in history. It seriously threatened Fargo and devastated Grand Forks.
How often, on average, will a flood of a particular size occur? What do we mean when we talk about a one hundred year flood or a five hundred year flood (after all, most rivers don't have flood data going back 500 years, so how would we know)?
If the occurrence of floods is essentially random over time, then the relationship between a particular size of a flood (discharge = amount of water going down the river per unit time) and the log of the recurrence interval (the average time between floods of that size or larger) will be linear. This relationship can be used to predict the recurrence interval for many types of catastrophic events,such as hurricanes, flash floods, seasonal floods (such as spring floods due to snow melt), earthquakes, etc.
Recognize that the assumption in this relationship--that the occurrence of the catastrophe is random with respect to time--may not be true. Climate change can make weather-related events like floods and hurricanes non-random through time. Earthquakes are related to build-up of forces in rock which may not be random with time. However, often the occurrence is close enough to random to provide us a guideline for how frequently events are likely to occur in a particular region.
Also, the distribution with time of smaller events may not be the same as the distribution with time for larger events, meaning that this relationship wouldn't be perfectly linear. However, it has been observed to be close to linear in many instances and so this relationship provides some predictive ability for large events that may have never been observed before.
The top graph below shows, qualitatively, how discharge for a flash flood versus log of the recurrence interval might look for three different drainage basins (with different slopes, soil type, rainfall probabilities and so forth). For one of these regions, some example data is shown by points. Notice that you can extropolate from the region of smaller floods where data are available to the likelihood of major floods that have never been experienced.
The lower graph shows an example relationship for flooding of the Red River at Fargo North Dakota. The biggest floods on the Red River tend to be seasonal, spring floods related to snow melt.

Let's think about how these graphs are constructed from observatonal data. Consider the lowest point on the graph for the Red River at Fargo/Moorhead. The discharge is about 10000 cubic feet per second. The log of the recurrence interval is about 1.15. This means that the recurrence interval is about 101.15, or about 14 years. This means that, on average, the floods of this size will occur about every 14 years. This chart is based on data from 1873, to 1973, a 100 year span during which there were 7 floods greater than or equal to 10000cfs, which comes to an average of about one every 14 years, which is the recurrence value shown. However, these floods did not occur on a schedule of one every 14 years. Rather, these floods occurred in 1882, 1897, 1943, 1952, 1965, 1966, 1969.
Also, notice that the point labled as "100 year flood" corresponds to a log recurrence interval value of 2. 102= 100, or the log of 100 = 2. The log of 500 =2.7.
Below are all floods of greater than 10000 cubic feet per second (cfs) on the Red River at Fargo, ND between 1873 and 2009. Copy and past this table into a spreadsheet and plot a graph with a predictive trend line to estimate the discharge of 100 and 500 year floods.
| Year | Discharge | |
| 1 | 1882 | 20000 |
| 2 | 1897 | 25000 |
| 3 | 1943 | 16000 |
| 4 | 1952 | 16300 |
| 5 | 1965 | 11400 |
| 6 | 1966 | 10700 |
| 7 | 1969 | 25300 |
| 8 | 1975 | 13200 |
| 9 | 1978 | 17500 |
| 10 | 1979 | 17300 |
| 11 | 1989 | 18900 |
| 12 | 1993 | 10100 |
| 13 | 1994 | 11200 |
| 14 | 1995 | 11000 |
| 15 | 1997 | 28800 |
| 16 | 2001 | 20630 |
| 17 | 2006 | 19800 |
| 18 | 2007 | 13400 |
| 19 | 2009 | 29400 |
Spread sheets are indispensible tools in science that you need to know how to use. They not only facilitate making repetitive calculations, but they allow data to be graphed and can do a variety or regression analyses and simple statistical tests. So, it would be a good exercise to try to figure out how to take the data and get the desired output from it (prediction of 100 and 500 year discharge) using a spreadsheet. Do this--figure it out! However, if you are stumped, I have put some of the steps you need to take inside quiz box below.
If you are not familiar with spreadsheets, it's a good idea to play around a bit on your own to try to figure out how to do these steps. However, for your convenience, and hopefully to make sure you don't just give up (!!), I provide a primer to explain how to do it in Excel in the file Primer_for_for_Surface_Hydrology_Recurrence_Interval_Graphing_Lab.pdf
When you have done this exercise using a spreadsheet and figuring out the mechanics for creating a recurrence interval chart, then take the quizes below to test whether you got it right.
In determining which houses might be at risk of flooding, one needs to think not only of discharge (which is the best value to use when predicting flood probabilities) but also river level. Whether houses will flood or not depends on how high the river reaches, which is related to discharge but also related to other factors such as the slope of the river and how much debris is present to obstruct flow. Thus, we need to determine the correlation between river discharge and flood stage, or elevation. This depends on factors such as construction of levees and how fast the water flows down the river (if the river spreads out more, then it won't rise as high for any particular discharge. Likewise, if it flows faster, it won't rise as high for any particular discharge).
Here is the correlation between discharge and river gage level for the Red River in Fargo as of 2009.
| River Stage (gage level in feet) | Discharge (cfs) |
| 24.9 | 8000 |
| 26.7 | 9000 |
| 28.54 | 10000 |
| 30.9 | 12000 |
| 32.4 | 14000 |
| 33.64 | 16000 |
| 35.75 | 20000 |
| 37.61 | 24000 |
| 39.3 | 28000 |
| 40.7 | 31600 |
You can again clip this table and paste it into a spread sheet, and create a graph that allows you to predict river stage for the discharges for the 100 year and 500 year floods that we determined above. When you have done this, proceed with the multiple choice questions below to make sure that you have it right.
last updated 9/13/2022. Text and pictures are the property of Russ Colson.