Structural Geology-Spatial Thinking Exercises
Earth Science Extras
by Russ Colson
Rocks not Folded or Faulted
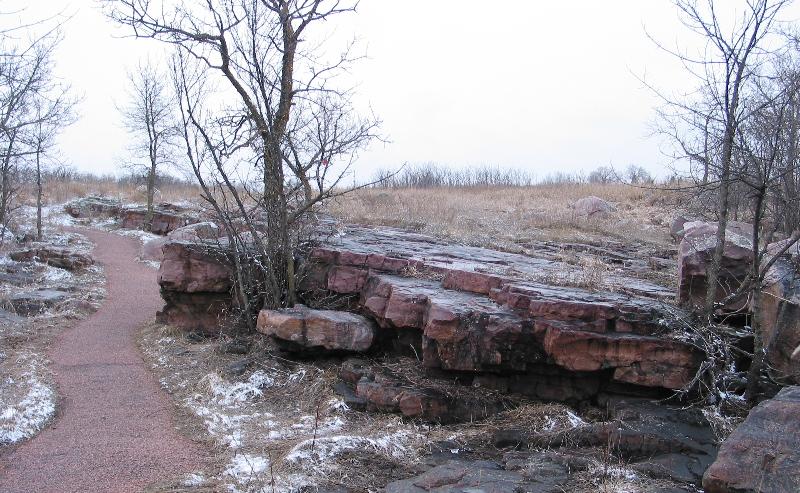
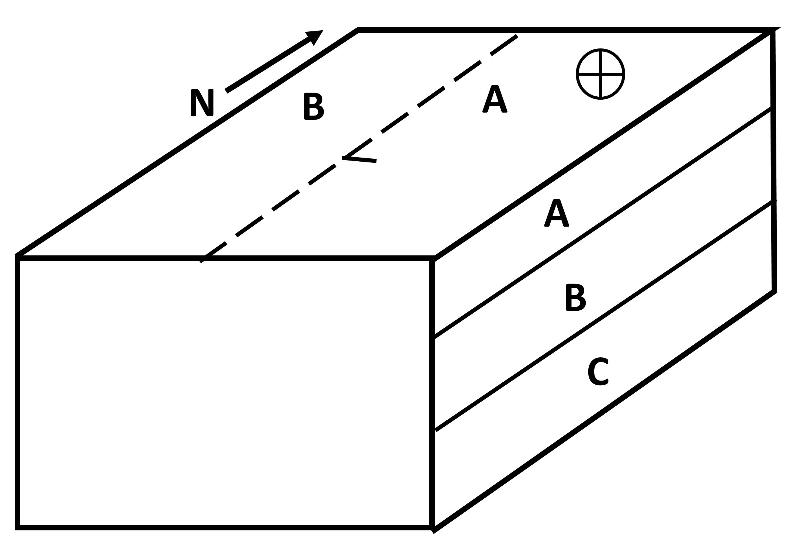
Take a few minutes to think about the block diagram above and complete the cross sectional view that is left blank in the front. Take note of the observational data on which this diagram is based: The geologist who created the map (the top view seen in perspective in the block diagram) measured the rocks at the surface to be horizontal (indicated by the plus in a circle), and only observed layer A at the surface, with contacts with no other rocks seen in the map area. The cross sectional view on the right must be based on other information, such as drilling core data or information about the regional stratigraphy from some nearby area. What will the front cross section look like? Do the multiple choice questions below to see if you got it right.
Click here to take the multiple choice version of this puzzle
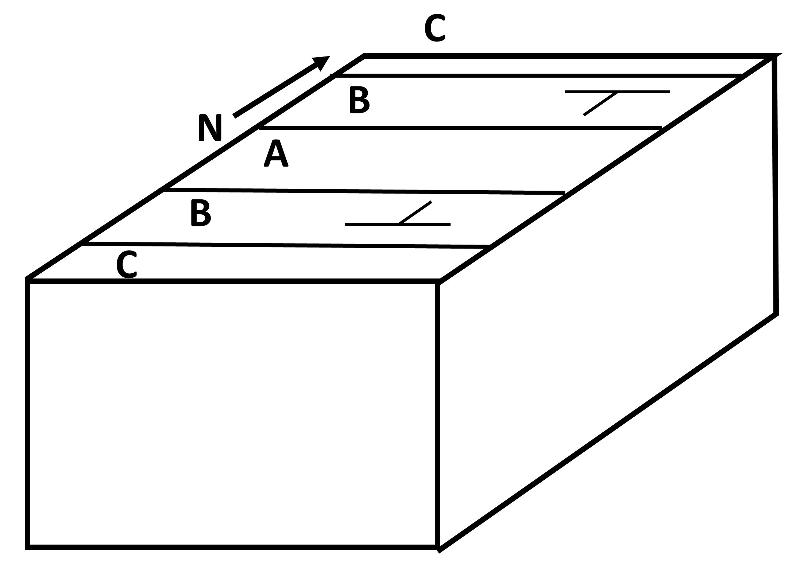
Take a few minutes to think about the block diagram above and complete the two cross sectional views that are left blank. Then do the multiple-choice question below to see if you were right.
Click here for a multiple choice version of this problem
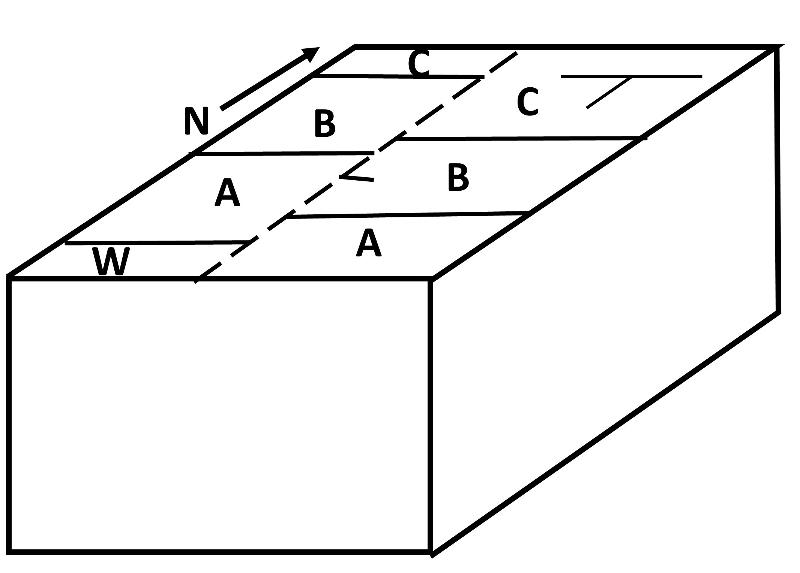
Take a few minutes to think about the block diagram above and complete the two cross sectional views that are left blank. Then do the two multiple choice questions below to see if you were right.
Rocks with Faults
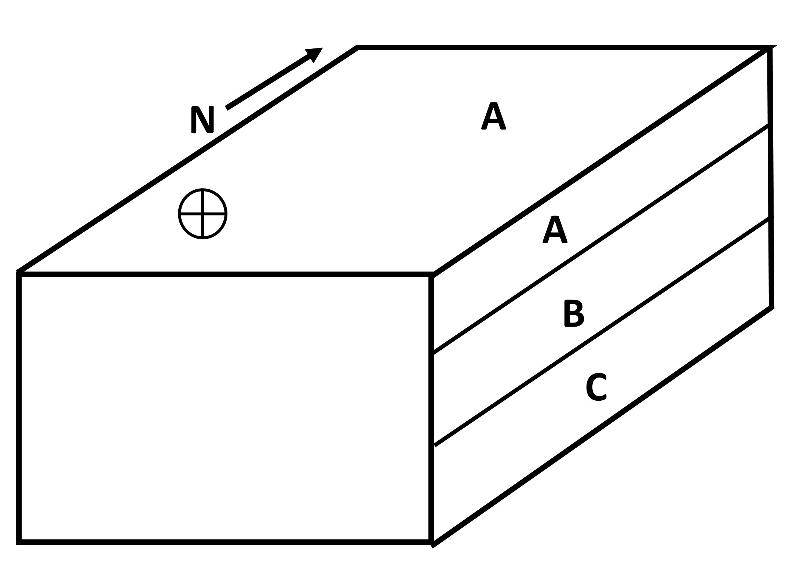
Take a few minutes to think about the block diagram above and complete the front cross sectional view that is left blank. In the map above, the dashed line represents a fault. (A fault is a break in the rock where the rock has moved.) The 'dip' symbol coming off the fault indicates the direction of dip of the fault, not of the rock layers. The orientiation of the rock layers as observed by the mapping geologist is indicated as being horizontal by the circle with a plus sign in it.
Click here for a multiple choice question about completing the block diagram above.
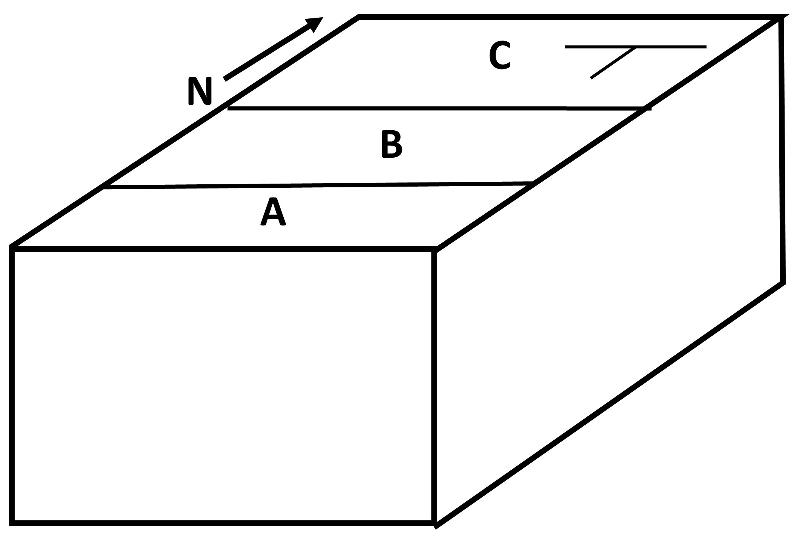
Take a few minutes to think about the block diagram above and complete the two cross sectional views that are left blank. In the map above, the dashed line represents a fault, and the 'dip' symbol coming off the fault indicates the direction of dip of the fault, not of the rock layers. The orientiation of the rock layers is indicated by the strike-dip symbol. This fault is not strike-slip, but which side of the fault has moved up can be inferred from the change in rock layers as one crosses the fault.
Rocks with Folds
Take a few minutes to think about the block diagram above and complete the two cross sectional views that are left blank. The orientiation of the rock layers is indicated by the strike-dip symbols. THen do the multiple choice question below to see if you got it right.
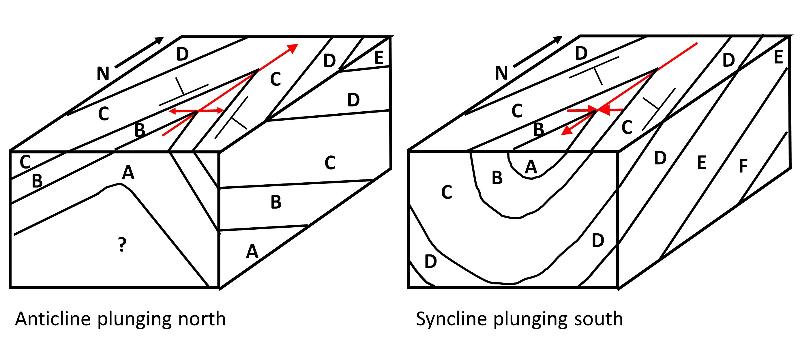
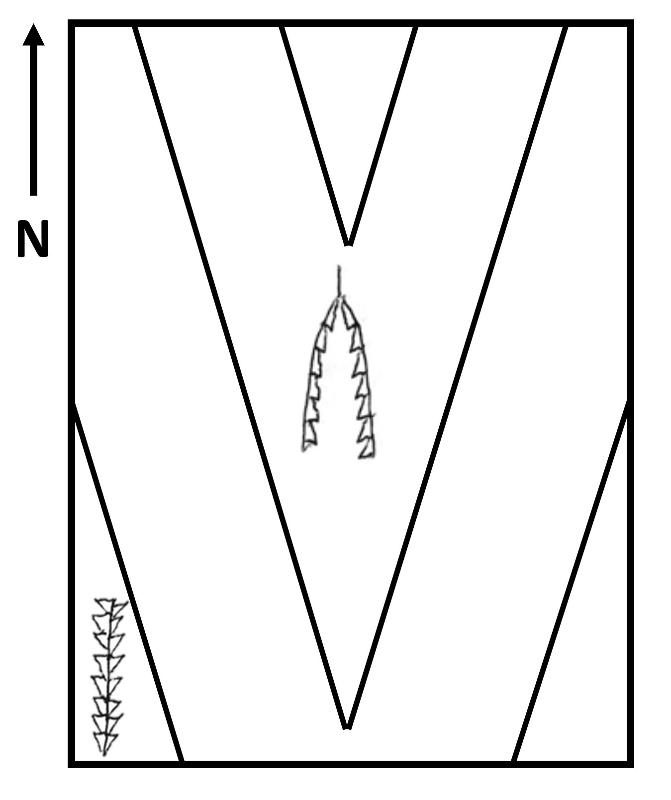
For our grand-finale challenge on the spatial thinking exercises, we are going to consider index fossils and faunal succession (the progressive change in organisms through time) as a means to infer whether a structural feature is an antincline or syncline. We are also going to look at a more complex situation where the fold is itself plunging, as was discussed in the lecture. Here are block diagram illustrations for the case where either an anticline or syncline are plunging. Notice that the dip of the rock layers seen on the right side of the block diagrams reflects only the plunge of the fold, not the fold itself, whereas the front cross section shows only the fold and not the plunge. Notice that the direction in which the rock outcrops 'V' in the map view depends on both the direction of plunge and whether the fold is an anticline or syncline. The red arrows mark the axis of the fold, with the arrow indicating the direction of plunge.
The index fossils we're going to consider are graptolites. Graptolites were colonial animals that lived in sea-weed-like apartment complexes that drifted over much of the sea and many different depositional environments during the Ordovician. Individual species had a fairly short range of existence and there was a progressive change in the type of colonies that they built, making it easy to identify what time a particular individual colony might have lived. In simplified form, the progression of body types from the early Ordoviian into the late Ordovician and early Silurian is shown below.
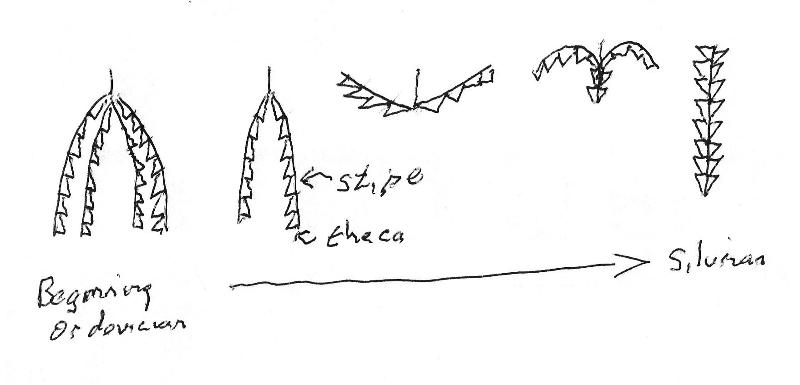
The Thecae are the "apartments" where individual animals lived in the colony, and the stipes are the dangly strings on which the apartments are built. The creatures drifted in the sea sort of like sea weed, resulting in their being distributed widely, a valuable characteristic of an index fossil. Notice that the progression is from more stipes that hang downward toward fewer stipes with the apartments reversed in direction and more tightly tied to a single stipe.
last updated 3/28/2020. Text and pictures are the property of Russ Colson.
