Soils Review: Textures, Horizons, Orders
Earth Science Extras
by Russ Colson
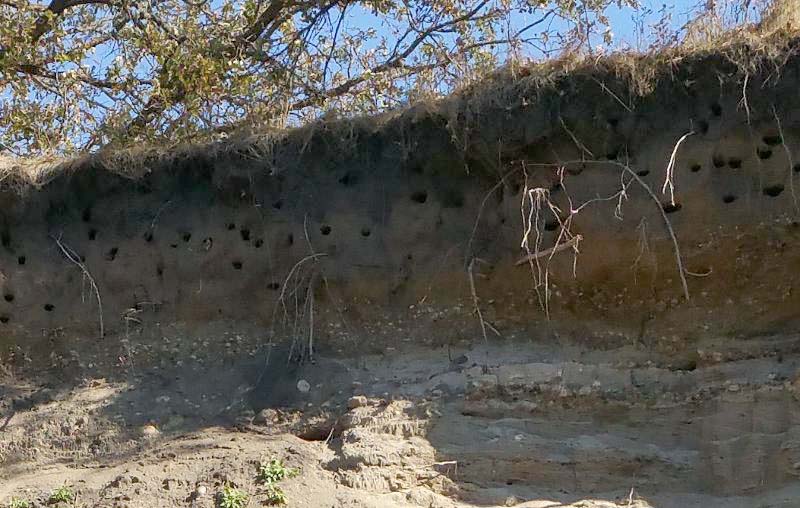
A and B soil horizons in a river cut bank at the Regional Science Center, NW Minnesota (and maybe the hint of an E horizon?--notice the lighter-colored band just below the A), with cliff swallow nests in the B/E horizon, and Fe-oxide accululation prominent in the lower B or upper C horizon (noticed the brownish, reddish, yellowish colors).
Lecture Recap
Soil Texture:
Soil texture refers to the proportion of mineral particles of different sizes in the soil. Sand-sized particles are generally between 2 mm and 1/16mm, silt-sized particles are between 1/16mm to 1/512mm, and clay-sized are less than 1/512 mm or roughly less than 0.002mm. Sand, silt and clay have different effects on soil properties, for example, more sand generally makes the soil more permeable and less water retentive. More clay generally increases the capacity of the soil to store and exchange base metals and other nutrients, makes it hold water better, but also makes it more difficult for water to permeate the soil (meaning that more rainfall will run off rather than seep into the soil during a rainstorm).
The texture name for soils can be determined from the Soil Texture Triangle, shown below (Adapted from the US department of Agriculture, USDA-NRCS Guides for Educators Soil Science Curriculum, https://www.nrcs.usda.gov/wps/portal/nrcs/detailfull/sd/soils/?cid=nrcseprd355621)
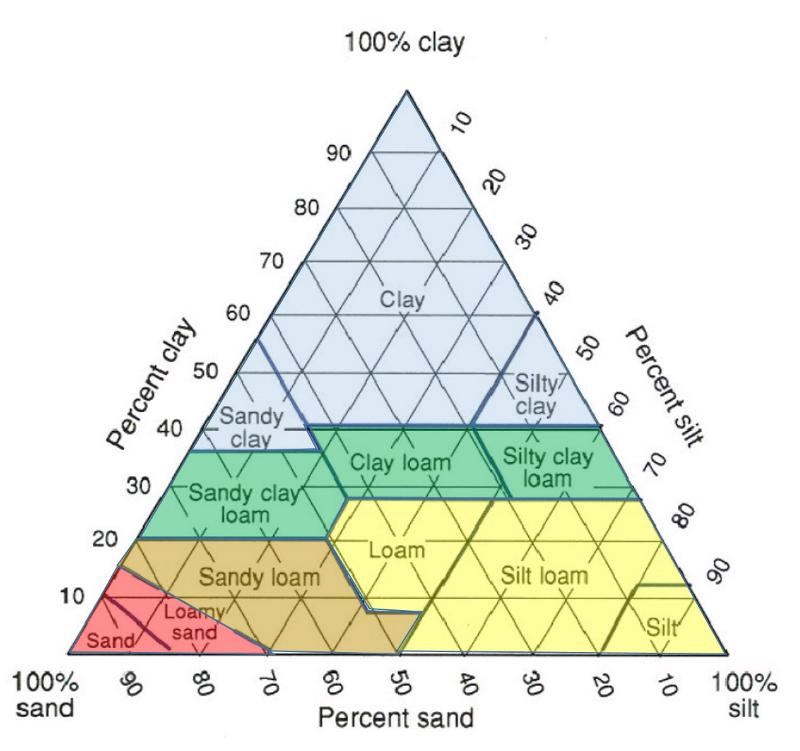
A triangular diagram is a common way to portray the percentage concentration of three different components that together add up to 100%. At any of the three corners, one component makes up 100% of the total and the other components are each 0%. Along each side, one component is 0%, and the other two components range from 0-100%, together making up 100%. Moving diagonally away from any one corner toward the opposite side, the component that is at 100% in the corner will decrease toward 0% in increments of 10% as each diagonal line is reached and crossed, with the other two components increasing to make up the remaining 100%. Study the diagram to figure out how this works.
Soil Horizons:
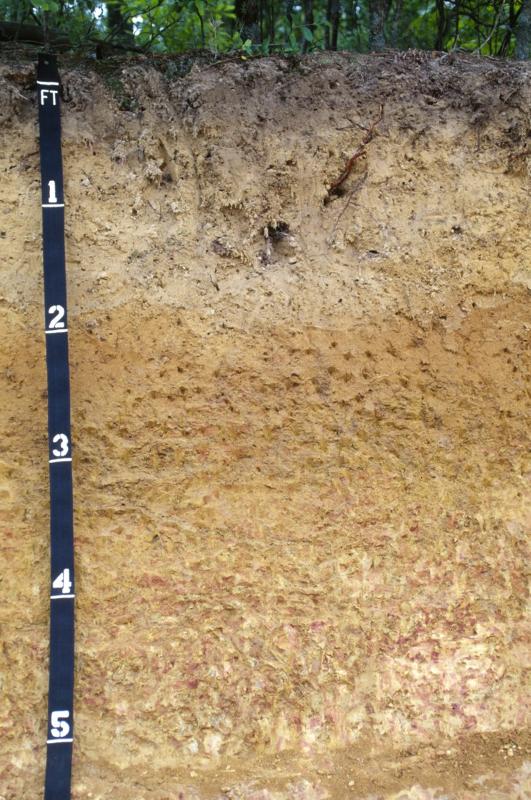
Consider the soil horizons seen below in the soil profile from Ashfall Fossil Beds in northeast Nebraska. This soil was establish on a deposit of volcanic ash that settled on the area 12 million years ago (Miocene times) from volcanoes erupting from what is now the Yellowstone hot spot, then under Idaho. Where do you think the boundaries between horizons might go? How did the horizons form? Can you spot any peds?
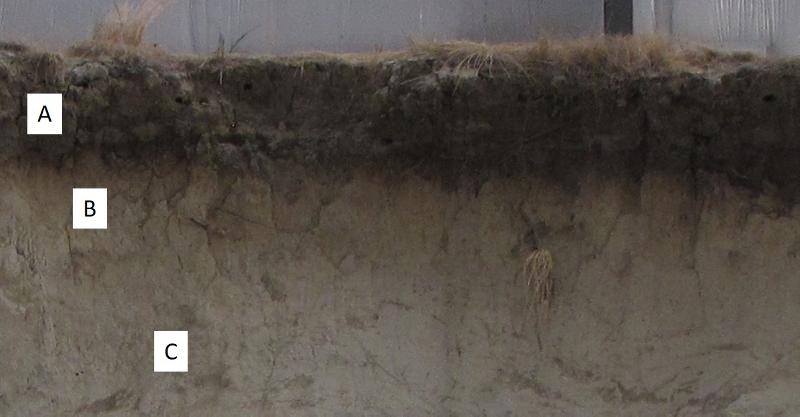
Consider the soil profile below from the coastal plain of Southeastern US, US Department of Agriculture Natural Resources conservations Service, Soils
A thought: Extensive weathering and soil formation in a wet warm climate is likely to have removed the more soluble elements by leaching and removed by eluviation many of the clay minerals capable of storing and exchanging nutrients.
Note: High base status of a soil refers to its relatively high proportion of base metals such as Ca and Mg, more common in less leached soils such as those in drier climates than in highly leached soils like in wet tropical regions. High cation exchange capacity refers to a soil's ability to store and exchange positively charged nutrient ions with rootlets of plants, often increasing with the proportion of clay minerals and humus in the soil. Soils with high base status also often have higher cation exchange capacity.
A thought: The thin A horizon must indicate either low organic availality or removal of the organic matter+clay minerals from this layer such that it does not build up to make a thicker A horizon. Since this soil comes from warm, wet SE United States, low organic supply seems unlikely and since the slopes are low, as considered in questions above, removal by erosion seems unlikely. However, the warm, wet climate might result in removal by eluviation, and also oxidation or consumption of organic matter at a rate faster than it is produced.
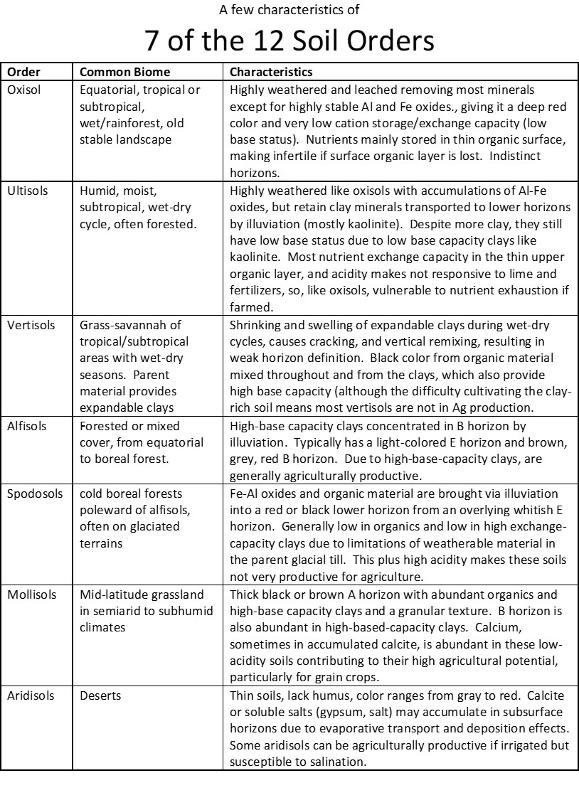
Soil Orders:
Soil order is a high-level grouping of soils (like "phylum" for living things) based on a few key features or processes that affect their formation, for example, type of parent material that is available, the type of vegetative cover, the shortage or abundance or rain, the warmth or coldness of the climate, the extent to which soil-forming processes have proceeded, and so forth. Below are some of the key features of seven of the twelve orders defined by the US department of agriculture (some other countries use alternative soil classification systems).
Now, with this information, try to identify the soil order of each of the following soil profiles or the likely climate/biome (pictures of soils are from the US department of Agriculture, https://www.nrcs.usda.gov )
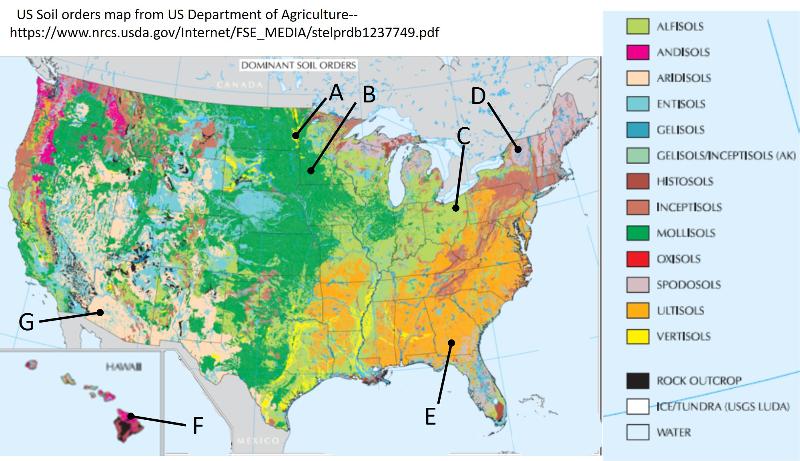
Study the soil order map for the United States below (from the US Department of Agriculture). Spend at least 5-10 minutes on this map--you are going to compare this map to an ecoregion map later on, and will also answer questions about soil order types, so familiarity with the map can help you address those questions.

Now study the ecoregion (Biome) map for the United State below (from the US Department of Agriculture, https://www.fs.usda.gov/land/ecosysmgmt/colorimagemap/ecoreg1_divisions.html ). Again spend at least 5-10 minutes on this map to become familiar with the ecoregions. Be sure to notice the Legend below the map.
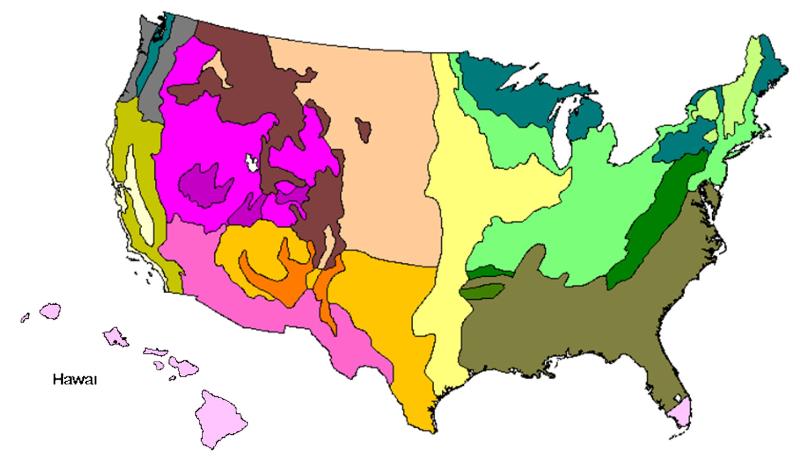
Spatial correlation is an important aspect of Geographical Information Systems. GIS software typically provides a variety of tools for identification and statistical analysis of spatial correlations. However, a conceptual understanding of geospatial correlation and an ability to recognize correlations from maps is important so that GIS software doesn't simply become a black box that spits answers out for you that you don't really understand. Consider the two maps above and ask the question: Are the soil orders and the ecoregions spatially correlated?
Consider the US Soil Orders map again, with a few selected soil type locations as marked on the map below. In the question below, you will try to match up each of the identiied soil locations with a soil description--for convenenience, the 7 soil orders chart is reproduced below (modifed for this challenge from the USDA map by Minnesota science teacher John Head--thank you!)
Some Human Effects on Soils
Soil type clearly affects humans in that some soils are more readily used for agriculture than others, producing higher yields with less investment of lime, fertilizer, and other adaptations. Some soils, like vertisols, provide a poor foundation for building due to the expansion-contraction properties of the expandable clays dominant in the soil. In addition to the effect that soils have on humans, humans and their activities can also affect soils. Three prominent examples might include the following:
Some soils produce highly productive forests, yet, once the forest is removed, the thin coating of humus providing nearly all of the base-metal storage and exchange capacity will soon be oxidized or eroded away leaving a very infertile, highly erodable remnant unsuitable for agriculture.
Some soils can be highly productive if irrigated, but addition of irrigation water, which evaporates leaving salts behind, will gradually salinate the soil and render it unusable.
Even soils that are otherwise highly tolerant of human agricultural use may change properties over time, possibly altering their fertility or productivity. For example, natural plants develop deep root systems over time, allowing the exchange of metals and nutrients from the surface to 20-40 feet down. However, crops that last only a single growing season will develop roots systems going down only a few inches or feet. Over long periods of time, this alteration of the nutrient cycle might result in redistributions of soil nutrients that affect the long-term fertility and productivity of the soil.
last updated 5/20/2025. Text and pictures are the property of Russ Colson, except as noted.