Problems in Wind Erosion--Interpreting Published Research
Earth Science Extras
by Russ Colson
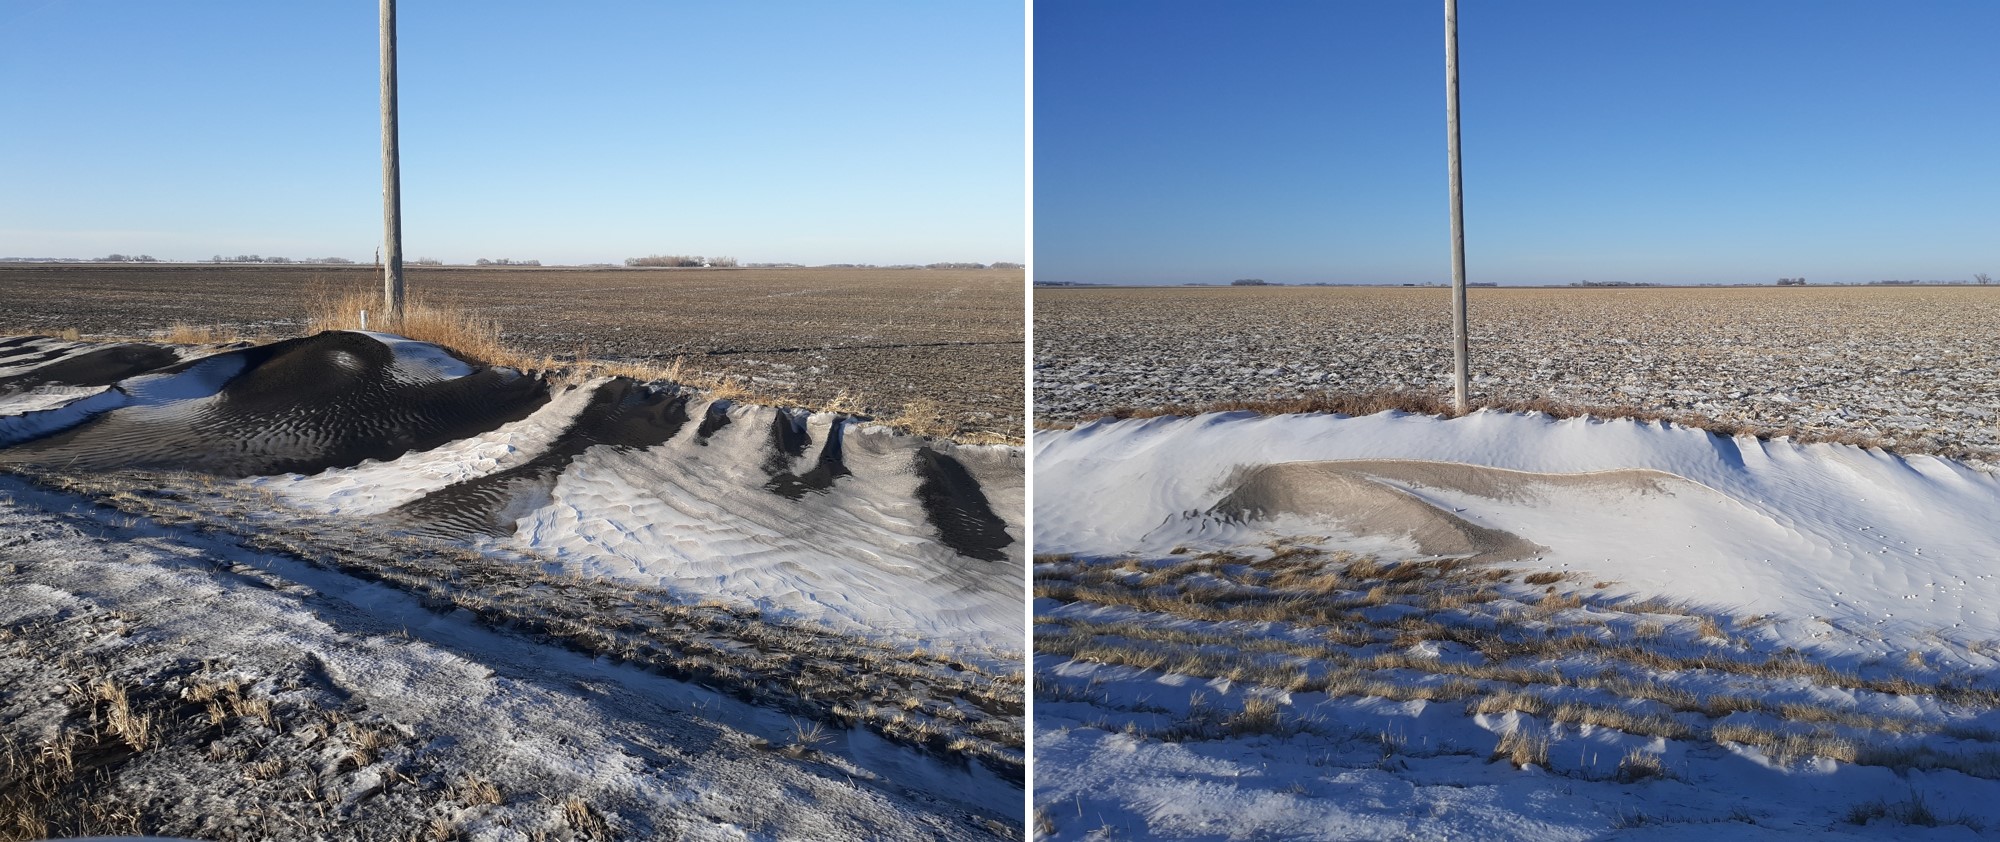
Two farm fields along Highway 26 in the Red River Valley of NW Minnesota, after the 'dry' blizzard of Dec 23, 2020, illustrating differential wind erosion. The field on the right has a heavy mulch of corn stubble, catching snow and decreasing loss of top soil. Locally, we call dirty drifts of this sort 'snirt'. Only 1-2" snow fell during the blizzard, but low visibility due to winds gusting to 60 mph closed down flights into Fargo and kept my incoming son stranded in Dallas for two days over Christmas!
In our examination of sustainable agriculture, and erosion and soil fertility in particular, we are going to focus on actual research related to sustainablity problems rather than provide broad, summary-style information. If you want broad summary-style information, feel free to google it--it's free on the internet. Why am I looking at real research, which is often harder to understand than the summary? It is important in teaching to recognize the difference between teaching science and teaching information. There is a joke that was common back in the days when I was working on my PhD that went something along the lines of "A PhD is where you learn more and more about less and less until pretty soon you know everything about nothing." Funny. However, the opposite can also be considered--and that is when you try to capture it all you can end up knowing nothing about everything. Information. Teaching can trend toward this latter end point, where students are given lots of summary information or explanations of models, but have no real understanding of how any of that information is derived, and thus have no understanding of science—only information.
This paper is from Soil Sciences, Vol. 88, No. 2.1950, by W. S. Chepil
First, let's practice reading and comprehending scientific text, starting with the Abstract and Summary--two key parts to a scientific paper that proved a synopsis of the author's understandinig of the key elements of the paper. Read through the text below several times, trying understand the significance of each part. What statements are background information of preceding ideas that this study hopes to test or to build on? What statements describe the investigative methodology or approach? What statements identify the primary goals or objectives of the study? Is there a statement of key observation or other evidence resulting from the investigation? Are there statement that provide the explanation of the results or how the results connect to the conclusions? What statements provide the key conclusions of the study?
Erosion of the soil by wind is influenced by numerous factors. Many useful methods of wind-erosion control have been devised through recognition of the importance of these factors in field experiments. Though such experiments have markedly increased our knowledge on how to hold the soil, they have not contributed appreciably to our knowledge of what constitutes an erodible or a nonerodible soil or of why some soils are more susceptible to erosion than others. Differences in erodibility suggest that inherent soil properties and properties brought about by cultivation and accelerated erosion play an important role. To obtain more specific answers to these problems a series of experiments was undertaken. The first of the studies was conducted to gain more adequate information on the generally recognized but little understood relationship between erodibility of soils and their physical structure. A part of the results of these studies is herein reported. Another group of experiments was undertaken to evaluate the effects of various physical and chemical factors on the erodibility by wind.
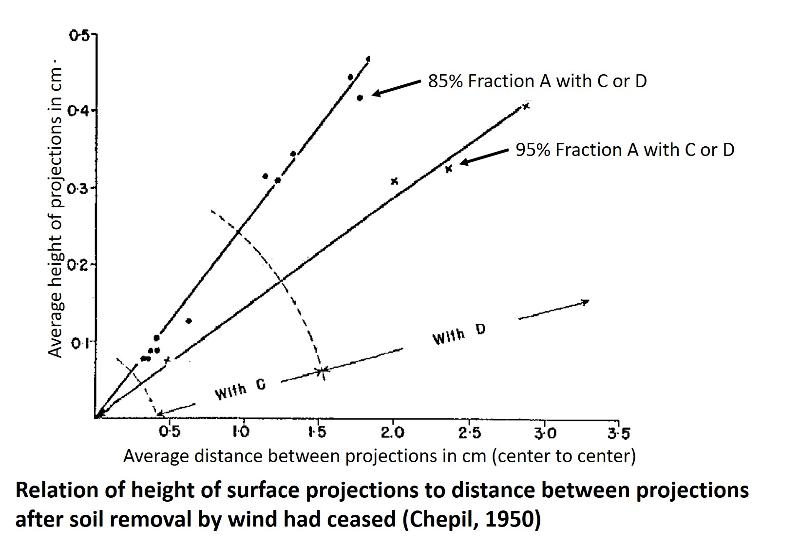
The amount of soil erodible by wind is limited by the critical height of and distance between the nonerodible fractions that are exposed at the surface by the wind. Erosion ceases as soon as this critical stage is reached. The ratio of height of surface projections to the distance between projections after soil removal has ceased remains constant irrespective of the size and proportion of the nonerodible clods contained in the soil. The ratio varies with other factors, however, such as wind velocity and size, shape, and apparent specific gravity of the erodible fractions. These factors, as a whole, add considerably to the complexity of the erosional phenomenon.
When you have read the text several times, then test your understanding with the questions below. (Please don't imagine that you can understand the text on the first reading--when I was a graduate student, a world expert in a particular subject told me that it takes them a week to read and understand a research paper in their own area of expertise--reading comprehension, like any worthwhile endeavor, takes sustained effort).
Although it is typical for the evidence to be included in the abstract of a paper, along with some reasoning that connects the evidence to the conclusion, no direct observational evidence is given in this case, but only the summary interpretations of the evidence--the conclusions of the research. The lack of evidence in the abstract is probably due to the extensive nature of the evidence, making it hard to summarize in a short statement, and to the close connection between the actual observations and the interpretation of those observations.
Although scientific abstracts usually include the evidence, and scientific papers always include the evidence, it is actually quite rare for research as presented in the popular news to contain either significant evidence or the reasoning that connects the evidence to the conclusions. News reports may provide the conclusions, often described at some length, and then refer to the methodology of the study as though the methodology counts as evidence ("spectroscopic evidence shows that the Moon is, indeed, made of green cheese" does not actually provide any evidence but only refers obliquely to a methodology or tool used in the investigation). We will examine some of the evidence for this study later on in this lesson. However, first, let's think about what the conclusions mean.
Can you figure out exactly what the key conclusions mean and how they connect to the real world? What are the implications of these conclusions for farming practices or soil usage?
Compare the conclusions of the study to the picture at the start of this lesson. The corn mulch is most like: the erodable fraction, the clods, the specific gravity,
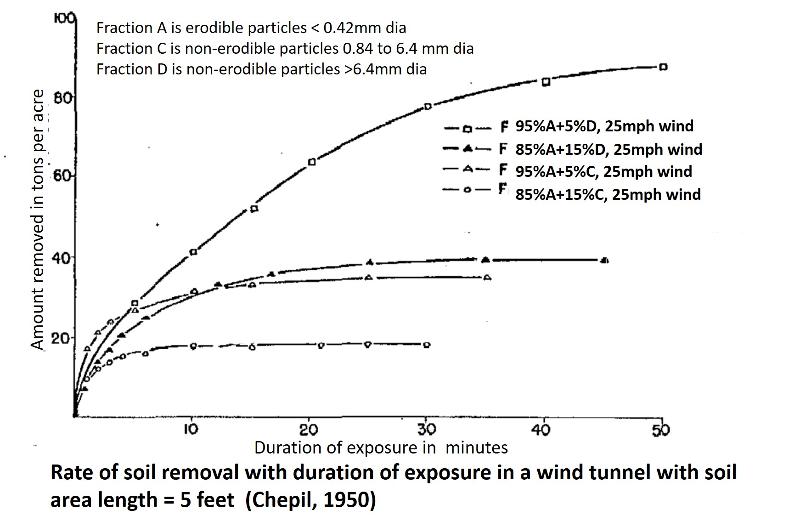
Below is one of the graphs from Chepil, 1950 showing results of the wind-tunnel experiments. Study the graph, taking care to pay attention to all of the axes labels and legend information. Think about the interpretation and implications of these results. When you are sure you understand, answer the following question (don't just guess--the whole point of this exercise is to practice interpretting data and reading graphs--the actual conclusions are not the goal of this exercise). (For the same reason, be sure that you always read and study the feedback for the question answers--the goal is not to 'know the answer to the question", but rather to understand how that answer was derived.)
Below is another graph from Chepil (1950) plotting some of the same data as in the previous graph, but in a new form, taking a step toward figuring out and illustrating a deeper interpretation of the results. Again, study the axes labels and other information on the graphy until you understand it. For example, do you understand what the word "projection" means in the context of the study? Given the context provided by the abstract and summary, the projections would seem to refer to the number and height of the clods 'projecting' above the surface of the soil. Can you figure out what the words "with C" and "with D" are telling you and why it matters? What is the relationship between average distance between projections and the number of projections (will there be more projections if they are farther apart or closer together)?
Think about what makes sense in these results. Does the fact that bigger particles are 'not erodible' compared to smaller particles make sense? Why?
Does the observation that more smaller non-erodible particles can stop erosion as well as fewer bigger particles make sense? Does the relationship between 'height' of the non-erodable particles and their number (distance apart) at the point when erosion stops make sense? Why?
Why would we get more net erosion with fewer bigger particles than more smaller ones? What is going on here?
This paper is from Agronomy Journal, Vol. 44, No. 5.1952, by A. W. Zingg, N. P. Woodruff, and C. L. Englehorn
We're not going to dive into this paper quite as far, but will look at one graph that portrays some of their key conclusions. First, read over their abstract to get a better understanding of the context and expeirmental methodology.
The planting of sorghum in rows running at right angles lo the direction of the prevailing winds has long been a recommended practice for reducing the wind erosion hazard. Critical studies of the practice, however, have not been made.
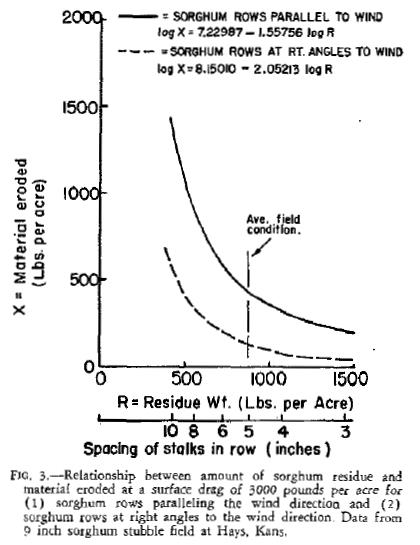
This study is in the nature of a pilot experiment dealing with only portion of the variables involved. Specifically, it is confined to one field of Ellis sorghum which was cut at a uniform 9-inch height with a field cutter. The field was located on the Munjor soil at the Fort Hays Branch Experiment Station near Hays, Kans. Wind tunnel studies of the field were made on November 15-16, 1950. A view of the field with the tunnel oriented parallel to the rows is shown in figure I.
We can see that the abstract is confined to pointing out the previous state of knowledge and the need for the study and then providing a brief description of the experimental methodology. Neither evidence nor conclusions are cited. Notice that the wind tunnel experiment is not being set up in a lab, but in an actual farm field.
Below is one of the figures from the study, illustrating some of the key results. Study this graph until you understand it, again looking at captions, legends, axes labels, plotted data (none shown in this case), and graphical interpretation of the data (shown as curves in this case). As before, the main objective of this exercise is not to 'get an answer' but rather to practice figuring out what graphcal representations tell us and making the connection between experimental data and the interpretation and conclusions of those data. Therefore, don't skip past the hard work of figuring the graph out in order to get to the 'answers' that will be given below as this defeats the whole purpose of the exercise (although do use the feeback in my answers to each question to fine-tune your ability to reason through the graph). The graph is from a scanned image of an old paper, so apologies for the poor quality.
How do the results of this study bear on the ways to mitigate erosion in our previous discussion (or in the discussion prompts)? Which mitigation methods are most related to these results and why?
How do the results of this study bear on the observations in the pictures of snirt at the start of this lesson? Which aspect(s) of the study is (are) born out by the observations in the picture and which are not addressed in the picture?
This paper is from American Society of Agricultural and Biological Engineers, Vol. 57(4): 1043-1055, 2014 by A. Retta, L. E. Wagner, J. Tatarko
As we have done before, read the following abstract several times to understand it. Aas before, work to figure out what statements are background information of preceding ideas that this study hopes to test or to build on? What statements provide the reason or need for the study? What statements describe the investigative methodology or approach? What statements identify the primary goals or objectives of the study? Is there a statement of key observation or other evidence resulting from the investigation? Are there statement that provide the explanation of the results or how the results connect to the conclusions? What statements provide the key conclusions of the study?
Also, take note of and think about the implied feedback loop (like those we talked about in the discussion) between truck traffic, erosion, air quality, and public health!
ABSTRACT. Potential increases in wind erosion that might be brought about by military vehicles traveling off-road during training are of concern to the U.S. military because wind erosion and vehicle dust emissions contribute to land and air quality degradation and can cause adverse effects on respiratory health. Field studies were conducted in the summer of 2012 at Fort Benning, Georgia, to assess the effects of military vehicle trafficking intensity on susceptibility to dust emissions. Quantitative data on soil and vegetation parameters are needed to make appropriate estimates of the susceptibility to dust generation from the soil surface and the magnitude of those emissions. The experiment consisted of making multiple trafficking passes with both tracked and wheeled vehicles and then measuring wind erosion parameters. A tracked (M1A1) and wheeled (HMMWV) vehicle were driven in a figure-8 pattern within replicated 40 m × 80 m plots. On each plot, three levels of vehicle passes were made. On the tracked plots, the M1A1 was driven a cumulative total of 1, 5, and 10 passes. On the wheeled plots, the HMMWV was driven a cumulative total of 10, 25, and 50 passes. The vehicles were driven repeatedly over the same figure-8 path. Bulk density, above ground biomass, and vegetative cover data were taken from the straight, curved, and cross-over sections of the vehicle tracks. Samples were also taken before the start of trafficking. Bulk density at three depths, total aboveground biomass, grass biomass, forb biomass, biomass by individual species, total cover, grass cover, and forb cover data were analyzed for differences between vehicles, vehicles passes, locations within the track sections, and their interactions. At the 5 cm depth, bulk density was significantly higher (p ≤ 0.05) than the control in both the M1A1 and HMMWV tracks. There was no significant evidence of soil compaction below 5 cm. At the end of all trafficking, grass and forb species biomass was reduced 65% to 100%. Vegetation cover showed strong response to vehicle type, trafficking intensity, location (within the vehicle tracks), and their interactions. Regression equations relating trafficking intensity by vehicle to reduction in cover and biomass were obtained.
The graphs below show the primary observational data (experimental results) on which many of the paper's conclusions were based. Study them to figure out what they mean. Read the captions, legends, axes labels to understand what is being shown. Think about the meaning of the uncertainty bars that are shown. Make sure that you understand how the two sets of charts differ and how they are the same. What do each of the 6 bar graphs show? what are p0, p1, p2, and p3?
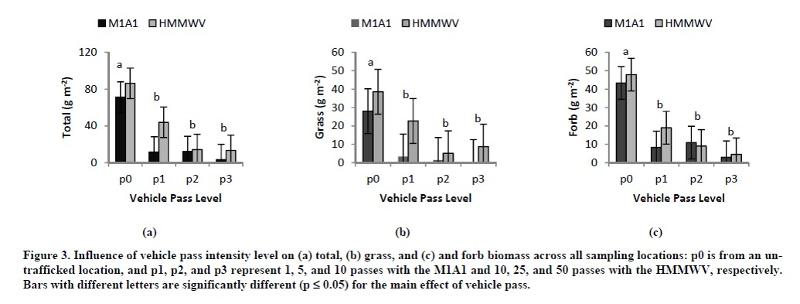
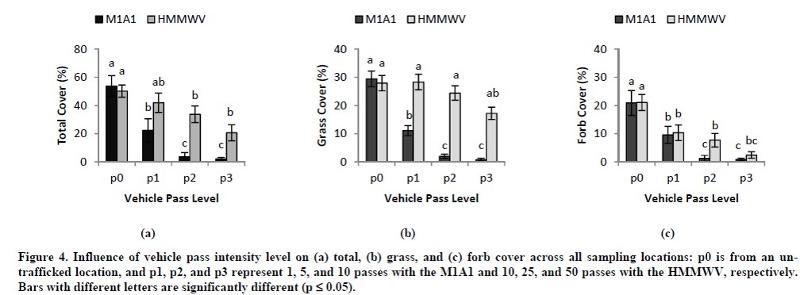
And so on. I'm not going to do a question for every possible thing that you need to know about these graphs, but hopefully this guides you to think carefully and specifically about each of the 6 charts.
Considering study #2 above, how will decreased biomass (or ground cover) affect erosion (notice that study #3 does not specifically measure sediment removal and yet claims to be a study of erosion, which only makes sense if you think about this study as building upon other studies that have come before it)?
Considering the abstract for study 3, how will erodibility affect air quality?
Use the data in the charts to argue for (or against) the key conclusion made in the paper abstract that "At the end of all trafficking, grass and forb species biomass was reduced 65% to 100%"
Here is another conclusion stated in the summary of the paper--use the data in the charts to argue for (or against) this conclusion--"cover showed strong response to vehicle type."
last updated 1/10/2021. Text and pictures are the property of Russ Colson except for material from research papers indicated in the text.