Ötzi the Ice Man and other Gechemical Fingerprinting Puzzles
Earth Science Extras
by Russ Colson
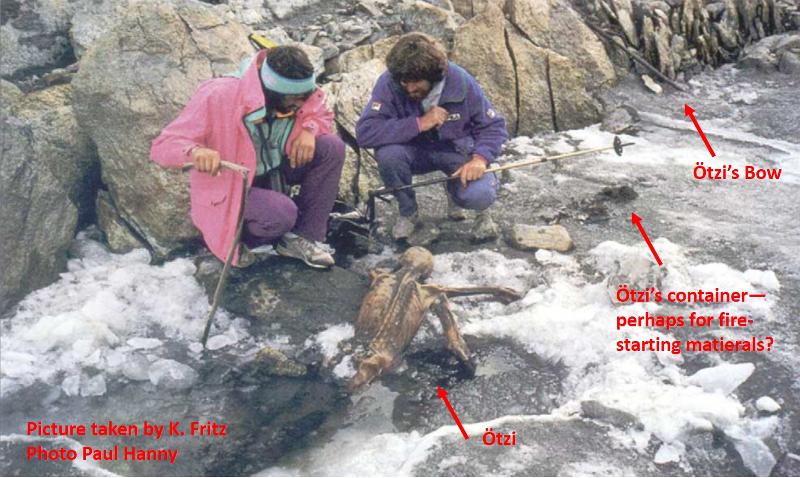
This picture of Ötzi the Ice Man, partially excavated from his final resting place in the ice, is modified from the research article "'Isotope language' of the Alpine Iceman investigated with AMS and MS" by Walter Kutschera and Wolfgang Meuller (2003), Nuclear Instruments and Methods in Physics Research B, 204 (2003) 705–719. Picture taken by K. Fritz. Mountainclimbers Hans Kammerlander (left) and Reinhold Messner are seen in the picture.
Variation Diagrams
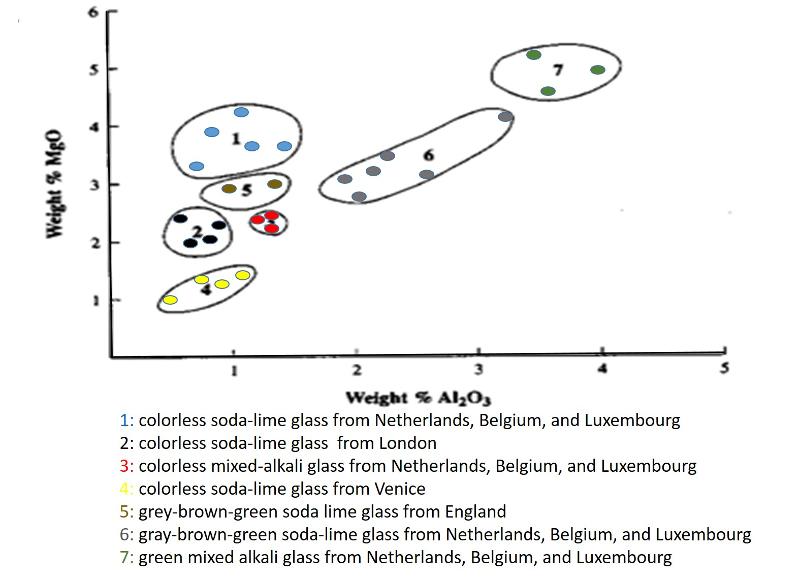
Statistical evaluaton of whether two groups of materials are compositionally the same or different can be done with computer applications that consider all elements or chemical components simultaneously. These applications test whether the materials are statistically different in multi-dimensional space. Three, ten, fifty, or even more compositional dimensions are simply a computational exercise for a computer. However, these muti-component comparisons are difficult to illustrate visually and difficult for the human mind to grasp. Therefore, it is useful to consider a smaller number of compositional variables at a time. Two elements (or other chemical components) can easily be charted on a graph, with one chemical component plotted on one axis and the other chemical component on the other axis, as was shown in a previous lesson for Eu and Fe in the stones from the Colossi at Memnon, Egypt. This type of chart is sometimes called a 2-element variation diagram because it shows the variation in chemical concentrations for multiple samples. This type of diagram is very useful in evaluating the possibility of correlations between the two compositional variables (as shown in a previous lesson) and also in illustrating distinct chemical differences among different populations of materials (thus, showing how each of those different populations has its own, unique chemical 'fingerprint."). An example of the use of a variation diagram to distinguish different populations of manufactured 17th century glass is shown below (with synthesized data for illlustration purposes), This chart is based on an illlustration from Henderson (2000) The Science and Archaeology of Materials, Routledge,.New York.
In addtion to having unique chemical signatures, materials can also have unique isotopic signatures.
Isotopes (of an element) are atoms with the same number of protons but different numbers of neutrons in the nucleus. Atoms with more neutrons are slightly heavier and the slightly heavier atoms can behave in slightly different ways during chemical differentiation. This can lead to differences in the ratios of heavy to light isotopes that can provide a signaature, or fingerprint, of that material. Also, some isotopes, called radiogenic isotopes, are formed by radioactive decay of a precursor, or 'parent', element. The amounts of these isotopes depend both on time and on the concentration of the parent element from which the isotope forms. This provides a different distinguishing fingerprint for many materials. Together, radiogenic and nonradiogenic Isotopes provide perhaps the most powerful and verstatile geochemical fingerprints for many materials.
Typically,different stable isotopes (isotopes that are not radioactive) are plotted against each other on an x-y diagram like the variation diagram above. Usually ratios of isotopes are plotted rather than the concentration of individual isotopes, both because the ratio can be more easily and accurately measured using mass spectroscopy and because the ratio is less easily disturbed by other factors in the environment and so the 'fingerprint' is more reliable.
Stable, nonradiogenic isotopes (isotopes that are not radioactive and also not formed by radioactive decay of parent elements) are typically plotted as a delta value. The delta value is calculated from a formula that provides a measure of how much the ratio of the heavy isotope to light isotope for a sample differs from a standard. A positive value means that the sample has more of the heavy isotope (relative to light isotope) than does the standard. A negative value means that the standard has more of the heavy isotope than the sample.
For example, the oxygen isotopes O18 (containing 8 protons and 10 neutrons) and O16 (containing 8 protons and 8 neutrons) are typically compared to the standard called SMOW (Standard Mean Ocean Water). A delta O18 value of -10 for a sample of river water means that the O18/O16 ratio in the river water is lower than the value from ocean water. This negative value for river water is typical because the river water has come from evaporation from the ocean, and when ocean water evaporates, water molecules with the lighter O16 evaporate more readily, making rain water enriched in O16.
In contrast to the stable, nonradiogenic isotopes, stable, radiogenic isotopes are typically plotted as the ratio of the radiogenic isotope to a non-radiogenic isotope of the same element. So, for some of the problems below, radiogenic lead Pb206 or Pb 208 is ratioed to nonradiogenic Pb204. Radiogenic strontium Sr87 is ratioed to nonradiogenic Sr86. The non-radiogenic isotopes (sometimes called primordial) were formed in the ancient stellar processes and supernovae that made most of the elements of our solar system, and so their abundance does not change with time as does the radiogenic isotopes.
Where did Otzi, the Ice Man, come from?
Ötzi the Ice Man lived over 5000 years ago and ended up murdered and frozen in glacial ice high in the Alps where he was found in 1991. But where did he grow up? Was he an explorer from far away, or a member of a village living high in the Ötztal Alps? When Ötzi was discovered in the Alps in 1991, many people speculated that he must have traveled a great distance since people 5000 years ago surely did not live regularly so high in the mountains. Analysis of the chemistry of Ötzi's teeth and bones give us clues to where he grew up and where he lived later in life.
The following puzzles use images and data from "Origin and Migration of the Alpine Iceman", by Wolfgang Müller, et al. (2003) Science 302, 862.
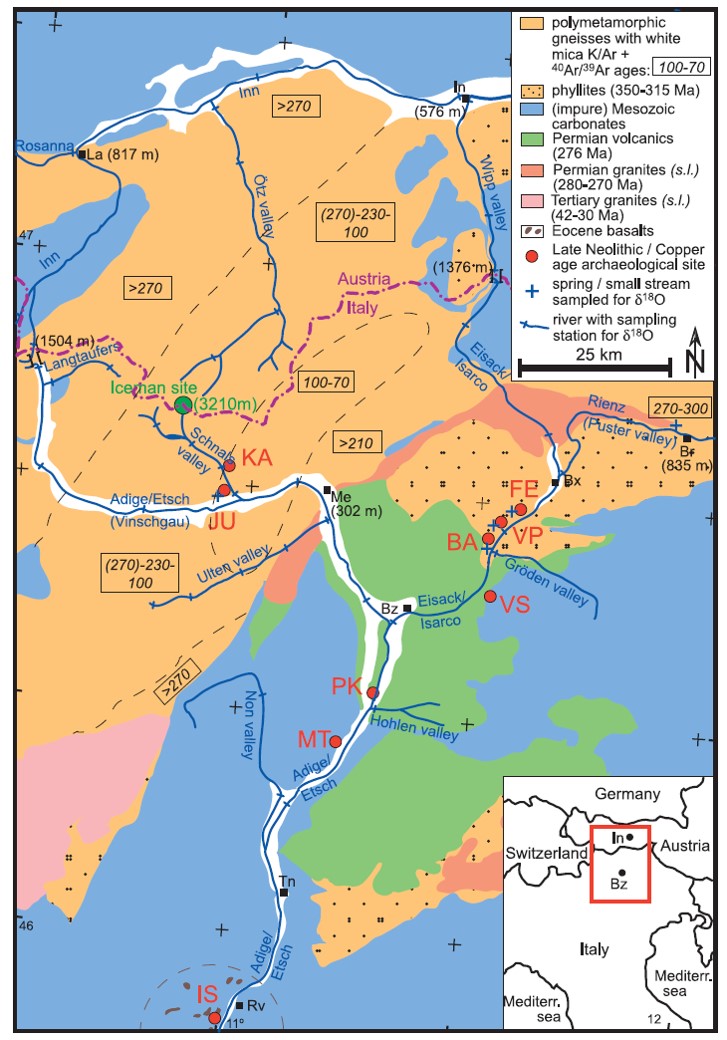
Study the map below (from Mueller et al, 2003) to become familiar with the region around where Ötzi the Ice Man was found. Notice the different types of rock exposed at the surface and where they oocur--the rock type affects the Sr (Strontium) and Pb (Lead) isotopic composition of the food and water that people living in those areas would incorporate into their bones and teeth. Rock ages are shown in black boxes. Read the map legend. Get familiar also with the different rivers and their names--the isotopic composition of O (oxygen) in water varies from one river valley to another and these oxygen istopic signatures also get incorporated into the bones and teeth of people living in those valleys. Notice the red-lettered regions (e.g. FE, JU, etc). These are the locations of archaeological sites that humans are known to have occupied near the time when the Ice Man lived. Find the Continental Divide between Austria and Italy and the location where Ötzi the Ice Man was found in ice high in the mountains. You should spend at least 10 minutes studying this map (it took me nearly an hour to find and understand most key features).
Sr and Pb isotopes are different in the soils formed in terrain with different types of rock and different ages of rock. These isotopes become incorporated into humans through drinking the water and eating food grown in the soil. Teeth and various bones in the body are formed and/or equilibrated with the environment at different times in a person's life, providing some indication of how conditions might have changed from childhood to adulthood. For example, the teeth enamel indicates conditions in young childhood, whereas some bones indicate conditions in adulthood.
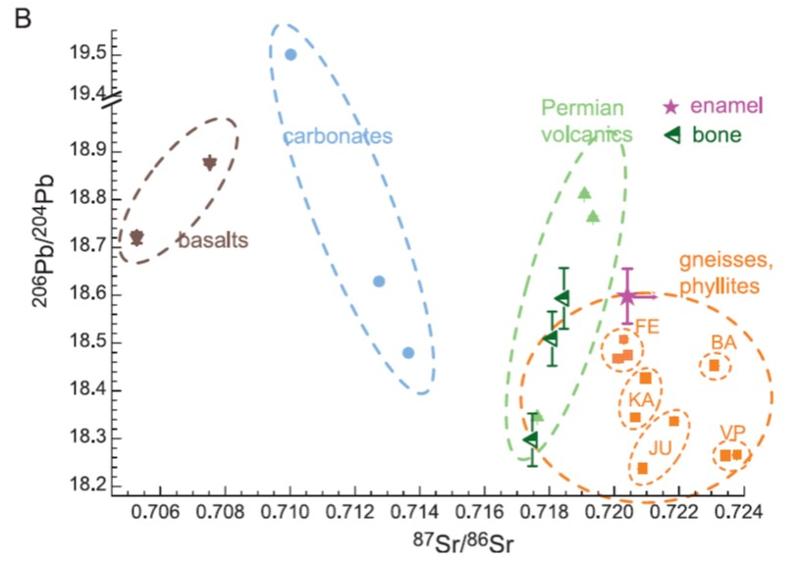
Study the graph below from Mueller et al (2003). Isotopic ratios for Sr and Pb and plotted on the X and Y axes. Enamel and bone indicate values measured in the teeth and seleccted bones of Ötzi the Ice Man. Uncertainties (1-sigma) for Pb are shown--uncertainties for Sr are about the size of the marker. Other markers indicate values measured in leachate of soils from different geological terrains. Uncertainties for these data points are smaller than the markers, although there is variation from one site to another that is greater than analytical uncertainty, as seen in the graph. The circle for gneisses and phyllites is expanded beyond the data reported here based on measurements made and reported by other researchers. Think about what you can and cannot conclude about where the Ice Man lived from this graph. Write down your conclusions and the evidence that supports it.
When you have completed the exercise above, including writing down your conclusions and evidence, test your reasoning and inferrences against the multiple answer question below.
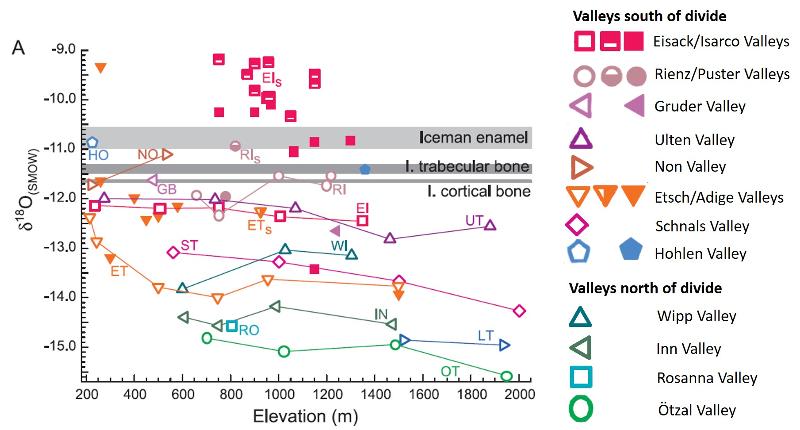
Consider the graph below modified from Mueller et al (2003), showing δ18O data [relative to standard mean ocean water (SMOW)]. Rivers are plotted as open symbols, local springs and streams appear as half-filled symbols, and modern tooth enamel samples (corrected for human-metabolic fractionation) appear as filled symbols. The δ18O values of water as calculated from the Iceman's enamel and bones are indicated by shaded bars (the width of the bar indicates uncertainty).
This is a complicated graph with a lot of data. Study it until you understand it (it took me over an hour). What conclusions can you draw from this graph? Write down your evidence and your reasoning for each conclusion.
When you have completed the exercise above, including writing down evidence and reasoning for each of your conclusions, test yourself with the questions below.
It is possible to group the river valleys according to whether they are 1) clearly a possible area for the Ice Man's childhood (the range of samples overlaps the uncertainty range for the Ice Man's tooth enamel), 2) a possible area for the Ice Man's childhood (the range does not overlap, but considering an uncertainty range of twice the observed range would bring them to overlap), and 2) probably not an area likely for the Ice Man's childhood (even doubling the observed range does not bring the delta O18 value into the range observed for the Ice Man's tooth enamel). You may have already thought through this exercise in your initial study of the graph, but, if not, take a few minutes now to do this excercise, writing down your answers and thoughts.
When you have completed the exercise, test yourself against the question below.
Based on Sr-isotope data, we conclude that the Ice Man must have spent all or mostly-all of his life in gneissic and/or Permian Volcanic terrain. In one of the questions above, we concluded that the Sr isotope data is not consistent with the Ice Man living at the site labeled "JU" later in life. However, mica flakes found in the Ice Man's intestines (presumably from material that got mixed into food when the food was ground between two rocks) have an 40Ar/39Ar age (Ar=Argon) of 95 million years.
So, if the Ice Man didn't live at JU, is it possible that he visited there?
Mueller et al (2003) propose the idea that, rather than the Ice Man moving to a new location as an adult, he instead made seasonal migrations. Perhaps, for example, he took herds to graze above the timberline in the southern Ötztal mountains during the warmer summer months. Such seasonal grazing is done in the region even today. Perhaps there Ötzi ate and drank materials with different O18, and Sr isotopic values, and his bones took on a time-averaged value between his home area (perhaps at FE?) and the places at higher elevation where he went for grazing during the summer.
Does this make sense in terms of how much time he would have to spend at higher elevations?
Suppose that we take the timberline as being around 2500 meters above sea level (The timberline elevation has varied somewhat over time due to climate changes). This might suggest that the summer grazing land was at elevations comparable to the upper Otz Valley (notice the elevations given in the map above). If you take the delta O18 values of the Otz Valley as characteristic of these elevations, how much time, per year, would Ötzii have had in the grazing fields (delta O15 values of say -15) if the rest of his time was spent near where he grew up (delta O18 of say -11), in order to end up with a time-average delta O18 in his adult cortical bone of say -11.7 (from the delta O18 graph above)? Does this make sense in terms of how much summer grazing might be possible?
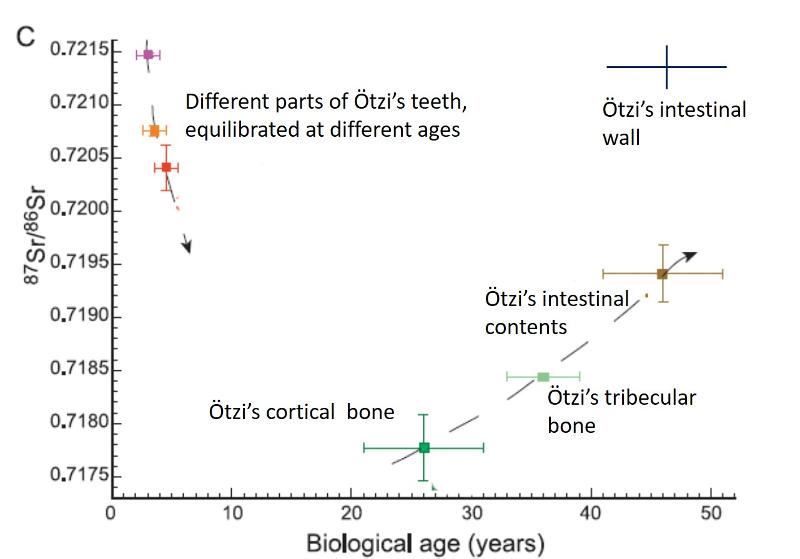
Mueller et al (2003) offer one more piece of evidence to support the idea that the isotopic signature of the Ice Man's bones reflect time-averaged residence in the area of his childhood and a seasonal grazing area higher in the Alps. The Sr isotopes of his intestinal wall do not match the Sr isotope signature of his bones, but rather match his teeth, as shown in the graph below, modified from Mueler et al (2003). Yet his intestinal wall surely represents a much more recent equilibration than his bones. Might it be that his intestinal wall tells us about his recent wintering back home where the Sr in his intestinal wall equilibrated to the same Sr istopic signature that his teeth had equilbrated too in his young childhood?.
To engage in a bit of complete non-science speculation, maybe Ötzi was killed in a conflict over grazing rights as he was either scouting for his animals in the spring, or bringing them up to graze?
There are many other questions to ask about the Ice Man. Did he trade for tools with people far away, or were his tools locally made? What kinds of foods did he eat? What style of weapons did he use? Some of these questions can be addressed with geochemical fingerprinting.
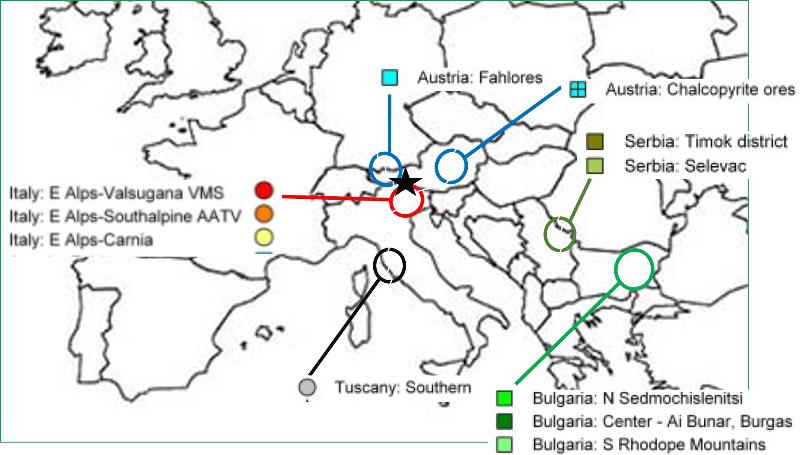
Ötzi lived during the copper age when important tools were made of copper metal that had to be mined from areas that had that resource. Since resources are where we find them, not necessarily where we want them, the need for copper forced people to engage in trade and some form of cooperation. Accessibility, cultural commonality, and political alliances would have been key factors determining where Ötzi's people got the copper for their axes. Because each copper mine has its own unique isotopic fingerprint, we can know today where the copper in Ötzi's axe came from. Some of the regional copper mines are shown in the map below. Look over the map to become familiar with the locations for copper deposits that might have been available to people of that time. The location where the Ice Man was found between Italy and Austria is shown by a black star. Copper mining areas are approximated by the colored circles.
The puzzle below comes from the research article "Long-distance connections in the Copper Age: New evidence from the Alpine Iceman's copper axe (2017) by Artioli et al. PLoS One. 12(7). Colors match the colors used in the map above.
Study the Pb isotope diagram below, which the authors call a bivariate plot (notice how is it very much like the variation diagrams that we talked about above). The composition of the Ice Man's axe is shown by the position of the black star. The Pb isotopic compositions of ores from a number of regional mines are shown by the other symbols. Can you exclude some of the possible ore sources from which the copper might have come? Which ones can you not exclude?
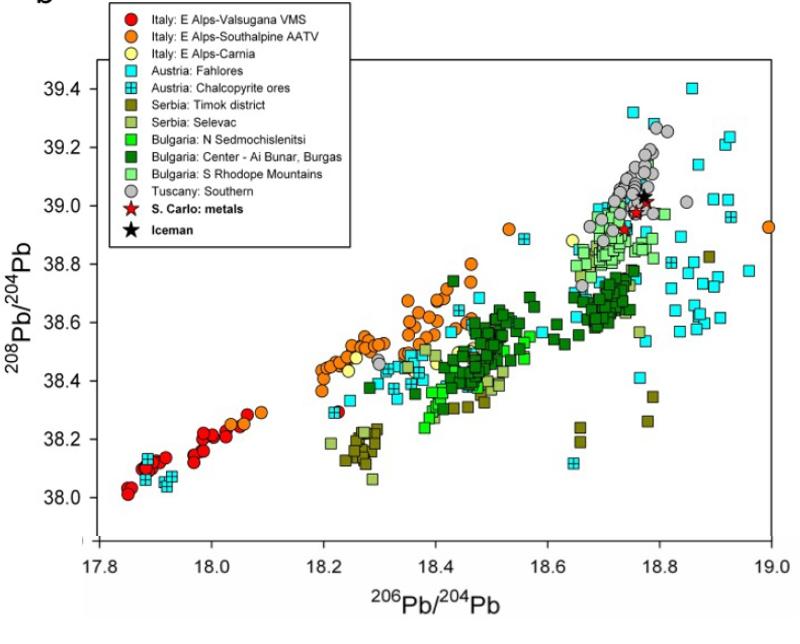
Although the Austrian, Fahlores, mines cannot be excluded on the basis of the Pb isotopes, we have some additional constraints based on elemental chemistry. The Ice Man's axe has very little Antimony (Sb). It's concentration was below detection limit for the technique of x-ray fluorescence in earlier studies, but found to be 18.6 ppm (uncertainty = 0.1) by the more senstive technique of mass spectroscopy by Mueler et al (2003). Another report (Krismer et al (2011) European Jrnl Mineralogy 23, 925-936) gives the concentrations of Sb in the ores from the Austrian Fahlores mines, and those values are used in the puzzle below. Note that the ore may not have exactly the same concentration of Sb as a smelted metal axe, however, other measurements comparing smelted metal to ore deposits for this time period in Austria show similar ranges in Sb composition for the ore and the smelted metal.
Although the Ice Man lived long ago, he lived in a thriving trade, economic, technological, and industrial environment! Some clues to those cultural complexities can be found in the geochemical fingerprints.
Is a mysterious building material from ancient Mesopotamia a natural stone, or a manufactured ceramic?
The following puzzle is simplified from the research of Stone et al, 1998, Science Vol 280 pg 2091 and based on a classroom exercise published at http://earthscienceissues.net/Fiction/Geological_Fingerprinting_Teacher_Resourses.htm, which provides classroom activities to be done in conjunction with reading of fictional short stories published at http://earthscienceissues.net/fiction_for_the_classroom.
Basalt-like stones were used in 2nd millennium BC Mashkan-shapir in Mesopotamia for construction of buildings and grinding of grain. The stones were vesicular gray-black stones. The word "vesicular" means that the rocks contained spherical spaces formed by gas bubbles when the rock was liquid, which tells us that the material was once melted and then re-frozen. Archaeologists wondered if these rocks were quarried at some unknown location and transported to the region where they were used (in which case, the stones were melted and cooled naturally), or if they were somehow manufactured by melting and cooling of some locally-derived rocks or sediments. If the latter, then these stones would provide an example of high-temperature ceramics manufacture from over 3000 years ago.
Archaeologists were able to answer the question using geochemical fingerprinting. They compared the composition of the basalt-like stones to other materials from the region and from around the world and realized that there was only one reasonable source for the stones.
Can you take part of their data (looking at only two elements instead of the many elements considered by the original researchers) and figure out the answer to the puzzle?
The two elements we will look at for this puzzle are Potassium (K) and Iron (Fe). To solve the puzzle, you need to compare the composition of the basalt-like stones used for building in Mashkan-shapir, Mesopotamia, to other rocks and materials from that region of Mesopotamia and from around the world. One way to begin is by making a graph on which you plot all the data, including specific points for specific rock samples and ranges of points for the entire range of compositions that are observed on earth for that rock type (the latter data will plot as an area on the graph rather than a point or a line).
Graphing Data
First, take some time to figure out how to draw your graph. What values will be on the axes? How do you plot a range of values (an area on the graph)? How do you plot a specific point? How do you plot a specific point that has a reported uncertainty range? After considering the data below, also think about the range of values (scale) that you need to use in order to plot the data on each of the x and y axes of the graph.
Here are your data
The basalt-like stone used for building in Mesopotamia (this is the sample you are going to try to 'match') :
The concentration of K = 1.34%
The concentration of Fe = 5.10%
Example single basalt composition from Minnesota
The concentration of K = 0.71%
The concentration of Fe = 10.22%
The range of compositions for basalt from Mesopotamia
The concentration of K ranges from 0.08% to 0.58%
The concentration of Fe ranges from 6.7% to 11.2%
The range of compositions for basalt from Hawaii
The concentration of K ranges from 0.08% to 1.3%
The concentration of Fe ranges from 7.42% to 10.7%
An example composition of a single sandstone
The concentration of K = 1.10%
The concentration of Fe = 0.99%
The range of compositions for sand and sandstone from around the world
The concentration of K ranges from 0.32% to 2.16%
The concentration of Fe ranges from 1.4% to 4.2%
An example composition of a single shale (mudrock)
The concentration of K = 2.7% (with a ± uncertainty of 0.6)
The concentration of Fe = 4.8% (with a ± uncertainty of 1.9)
An example composition of silt and mud from a river near Mashkan-shapir in Mesopotamira
The concentration of K = 1.33%
The concentration of Fe = 5.19%
The range of compositions for shale and mud rocks from around the world
The concentration of K ranges from 1.33% to 2.81%
The concentration of Fe ranges from 1.04% to 8.56%
The range of compositions for granite from around the world
The concentration of K ranges from 2.85% to 4.45%
The concentration of Fe ranges from 1.54% to 2.46%
The range of compositions for limestone from around the world
The concentration of K ranges from 0.04% to 0.61%
The concentration of Fe ranges from 0.3% to 1.46%
Since you need to plot the ranges given as areas on the graph (like the circular areas on the example variation diagram at the start of this lesson, except the areas you plot here will be rectangular), the graphing probably needs to be done manually. Graphing skills involved include choosing a range for each axis, which implicitly chooses a scale, plotting values accurately, and choosing methods of representation that make the meaning of the data clear.
Graph the data before proceeding--click here for instructions
Interpreting data
When you have completed the data interpretation and arguing from evidence exercise above, test yourself with the multiple choice question below.
Note: data for the composition of the ceramic and Egyptian natural materials are from Stone et al (1988) From Shifting Silt to Solid Stone: The Manufacture of Synthetic Basalt in Ancient Mesopotamia Science Vol 280 pg 2091. Other data are from miscellaneous sources.
With nothing left but the greasy residue in cooking pots, can we figure out whether ancient people were eating grains, veggies, or beans?
The puzzles below come from the research article "Reconstruction of prehistoric plant production and cooking practices by a new isotopic method" by Hastorf and DeNiro (1985), Nature v 315, 489-491.
The isotopic composition of various plants reflects not only the istopic composition of the atmosphere and local isotopic abundances, but also the fractionation and partitioning processes that are unque to the metaboloic process of each type of plant. Different metabolic processes of the C3 and C4 plants can result in differences in the proportion of carbon isotopes (C12 and C13) in plants. Likewise, the Nitrogen-fixing bacterial action associated with legumes can result in differences in the proportions of nitrogen isotopes (N14, N15).
The graph (from Hastorf and DeNiro, 1985) below shows differences among these three groups of plants, based on analyses of burned plant remains from Peru. C3 plants include things like many of the grasses (including wheat, rye, oats, rice), quinoa, tomatoes, squash, sunflower, sugarbeet, etc. plus nearly all of the legumes. C4 plants include maize (corn), sugarcane, millet, and some grasses. Legumes include plants such as beans, alfalfa, soybeans, lentils, and peanuts. Boxes in the graph below show the expected ranges of the isotopes for each type of plant. Markers show actual measurements for burned plant material identified in each of the plant groups (burned plant material was used to provide for more reliable comparison with plant residue in ceramic cooking pots).
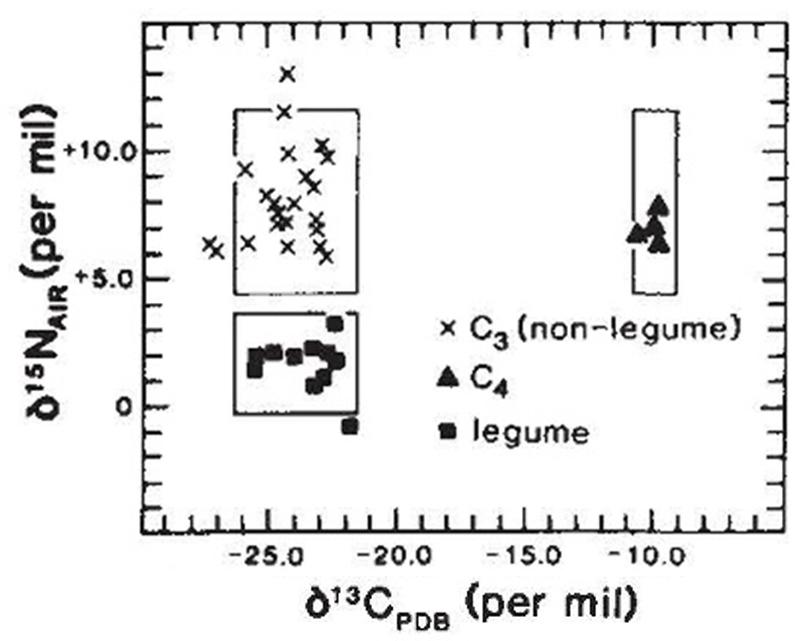
Data for the puzzle below is from Jahren and Kraft (2008) "Carbon and nitrogen stable isotopes in fast food: Signatures of corn and confinement", PNAS v 105, 17855-17860. It is compared against the C and N isotopic zones from Hastorf and DeNior (1985). Be aware that comparing the carbon and nitrogen isotopes of beef to plant material may not be straight forward because, in beef, the isotopes have gone through additional metabolic processes in the cow and may have been fractionated in a differnt way. However, for our purposes below, we will consider this effect to be small.
Where did ancient people get the ingredients that they used to make glass?
Glass was invented sometime before 5500 years ago when it came into prominent usage in both Egypt and Mesopotamia. Three primary components are needed to make glass. 1) the former is the main constituent of glass that causes it to freeze into glass rather than into a mass of tiny crystals. It provides the structural integrity of the glass. In most glass, both in ancient times and today, this constituent is SiO2. 2) The flux is the constituent that lowers the melting temperature enough to make it easy to melt and pour. In most glass, both ancient and modern, this constituent is Na2O. 3) The stabilizer is the constituent that prevents the highly-mobile Na2O from leaching out of the glass too quickly. In most ancient glasses this constituent was CaO, although PbO was used in the famous leaded glasses of China and much later in Europe.
Where did ancient people get the raw materials for the SiO2,Na2O, and CaO? SiO2 is the main constituent of quartz which makes up much of beach sand. For a more pure source (needed for clear glass) ancient people could use quartz veins. Both of these sources were failry common and easy for ancient people to access. CaO sources were also common, since CaO is the main component in seashells and limestone. Na2O could be found in the ash of certain halophytic desert plants or in the mineral trona.
Do we have any way to figure out which type of raw materials ancient people might have used, thus giving us insight into their mining and technological methodologies?
Yes. Each source comes with its own set of trace and minor element impurities that can give us clues to what type of raw material was chosen by a particular group of people at a particular time and place.
We are going to consider MgO, an impurity hat is usually found in ancient glass.
MgO is present at significant concentrations in the ash of the halyphytic plants but not in Trona. Depending on the exact type of halophytic plant chosen to burn for sodium, the MgO concentration might either be particularly high, or moderately high.
A common source for CaO is carbonate rock like limestone. However, one type of carbonate--dolomitic limestone--also contains a lot of MgO. If dolomitic limestone were uesd as a source for CaO, the MgO would come along for the ride as an impurity.
Because ancient people might not make their glass with exactly the same concentrations of CaO and Na2O, (either intentionally to achieve some desired effect or unintentionally due to uncareful measurements or due to variatons in process from one place or person to another), there will also be variatons in any impurities that 'go along for the ride' when materials are added to the glass.
Do unexpectedly-high concentrations of light hydrocarbons in the residue of oil and deisel spills in Bemidji MN and Mandan ND suggest that a second source of pollution is involved, and, potentially, a second guilty party?
The use of geology to solve crimes in fiction goes back at least to Sherlock Holmes' use of different types of mud samples in the 1800s. Fossils, minerals, and chemical composition are clues to where a sample came from, with each rock and each region having its own unique mix of fossils, minerals, and chemical elements. Geochemical fingerprinting has been used to identify art forgeries, to track the progress of ancient economies, and to uncover ancient political crimes. It is also used in a wide range of scientific endeavors, including understanding the formation of the Moon, locating hidden ore deposits, and predicting the best place to drill for oil or dig a canal. More recently, geochemicial fingerprinting has been used to solve environmental mysteries and crimes.
The puzzle below is based on work reported in "Forensic Fingerprinting of Oil-Spill Hydrocarbons in a Methanogenic Environment–Mandan, ND and Bemidji, MN", by Hostettler et al, (2007), Environmental Forensics, 8:139–153.
In simple form, hydrocarbons consist of chains of carbon atoms that are linked together. Hydrogen atoms branch off of the carbons where there are extra bonding sites (generally, each carbon atom can have 4 bonds). Methane has a single carbon atom with 4 bonded hydrogens. Butane has 2 carbons atoms, bonded to each other and with three hydrogens bonded to each carbon. Propane has 3 bonded carbons, with 2 hydrogens bonded to the middle C and 3 hydrogen to each of the end carbons. And so on, up to very large numbers of carbons. Sometimes the carbons, instead of being long chains, can take on other forms, such as branches, loops, and rings.
Typically, degradataion of petroleum products in the near-surface environment results in the progressive loss of lighter-weight hydrocarbons (the shorter-chain hydrocarbons) due to processes such as preferential evaporation and oxidation of the lighter hydrocarbons. This loss of lighter hydrocarbons increases the relative concentration of the heavier hydrocarbons.
The graph below shows analysis data for various hydrocarbon materials from the spills at Mandan and Bemidji. Peak heights (on the y axis) increase as the relative concentration of hydrocarbons with different numbers of carbons (shown on the x axis) increases. In this chart, the samples indicated in bold (RR40 and BE-31) are the materials thought to be the primary spilled materials (based on similarities in the particular mixtures of types of hydrocarbons). Graphs from Hostettler et al 2007.
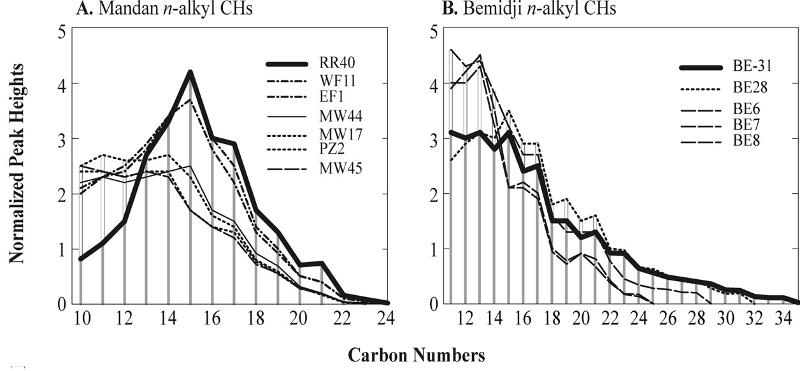
RR40 is an off-road diesel fuel that may have been spilled over a period of 50 years in the railroad yards and downtown area. It's composition matches many aspects of the spill. However, based on the unexpectedly high concentrations of light hydrocarbons, it was suggested that the spill of diesel at Mandan may have become mixed with some other component. or example, kerosene might have added some of the unexpectedly light components.
The graphs from Hostettler et al (2007), reproduced again below, list the different spill samples in order of increasing degradation downwards (based on known passage of time at the Bemidji spill and based on stratigraphic horizon and other information at the Mandan spill). Is the data most consistent with a 'regular' degradation pattern plus admixture of kerosene, or with an unusual degradation pattern without the admixture? Think about the problem and construct an answer with explanation before attempting the multiple choice question that follows (after all, real forensic scientists don't get nice "guiding" multiple choice questions to help them figure things out!).
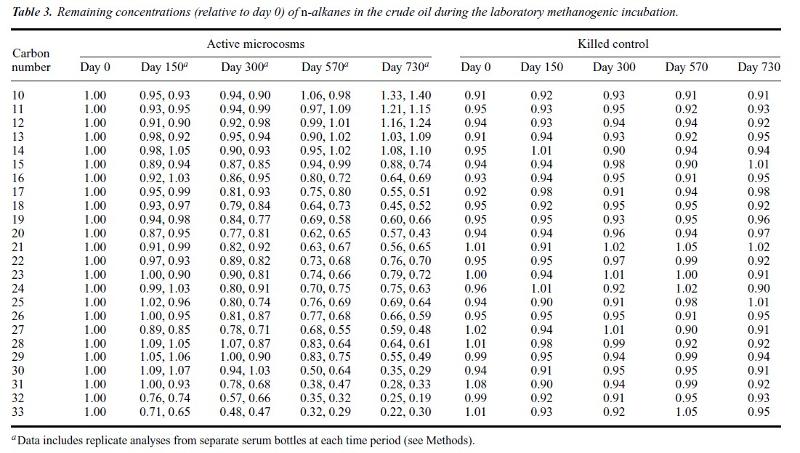
The progressive trend in hydrocarbons at both Bemidji and Mandan are consistent with the progressive loss of heavier hydrocarbons. However, since this is opposite the typical trend with degradation, extra effort needs to go into proving that the reverse degradation trend is, in fact, occuring, rather than some other process or admixture of materials that we are not understanding. Consequently, Hostettler et al (2007) did experiments to see if they could replicate the trend by exposing a sample petroleum to bacterial action under conditions in which the petroleium couldn't be oxidized or significantly evaporated. The table below shows their results. Be sure to read the table headings and footnotes so that you understand what chart is telling you before attempting to interpret the data. Again, try to interpret the data with evidence and reasoning before you take on the multiple answer question below (chart from Hostettler et al, 2007).
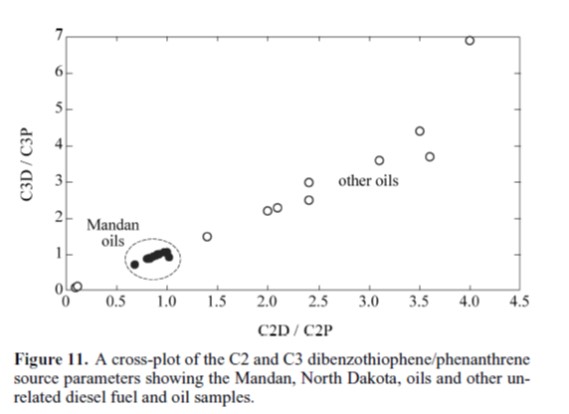
Although the data above suggest that some 'chemical fingerprints' in hydrocarbon spills can be compromised by unexpected effects of bacterial degradataion over time, other chemical signatures are not affected by these processes. Hostettler et al (2007) demonstrate both that some fingerprints are not compromised and show the Mandan spills are not contaminated by other admixtures through the use of the figure below. The minor scatter in the Mandan data in the variation diagram below suggests both that the plotted parameters have not been strongly affected by degradation and that the diesel has not been mixed with other materials or oils which whould have more strongly changed the values of the parameters. The small amount of variation in the Mandan data can be explained by the variations in the exact type of diesel fuel used over the 50 year time period when the spills were accumulating. Notice that Hostettler calls the diagram a 'cross plot'.
The Rocks of Stonehenge, England
Stonehenge is a circle of giant stones built some 5000 years ago on the Salisbury Plain in England. The stones are so large, and the construction so dramatic, that people have long wondered where the large stone came from and how they were transported. We are going to examine a small part of two studies that use geochemical fingerprinting to identify and confirm the source of the two main types of stone. The smaller stones (still quite large) are made from an igneous rock, dolerite, sometimes called bluestone because of its bluish cast. The larger stones (up to 22.6 metric tonnes!) are made of silcrete, a material formed when silica-rich water seeps through other rock and replaces it with layers or lenses of quartz-rich material. This material is called sarsen locally.
Where did the large vertical sarsen stones used as the main architectural stones in the the 5000-year old structure at Stonehenge, England come from?
This puzzles comes from Nash et al. (2020) Origins of the sarsen megaliths at Stonehenge, Sci. Adv.6 : eabc0133 29
The map below from Nash et al (2020) shows the location of Stonehenge and various possible sources for sarsen stones.
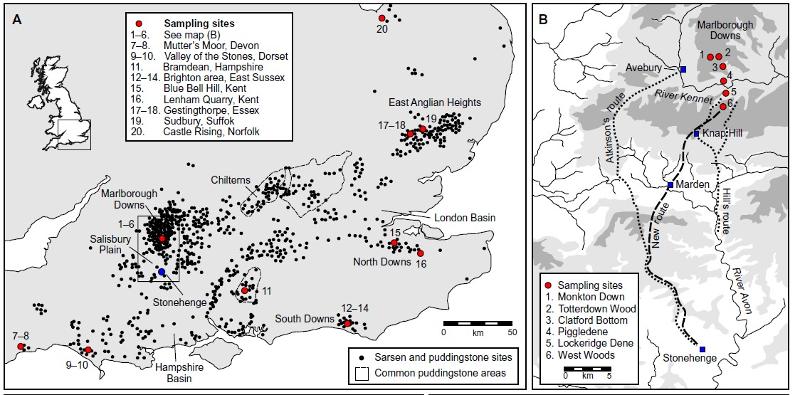
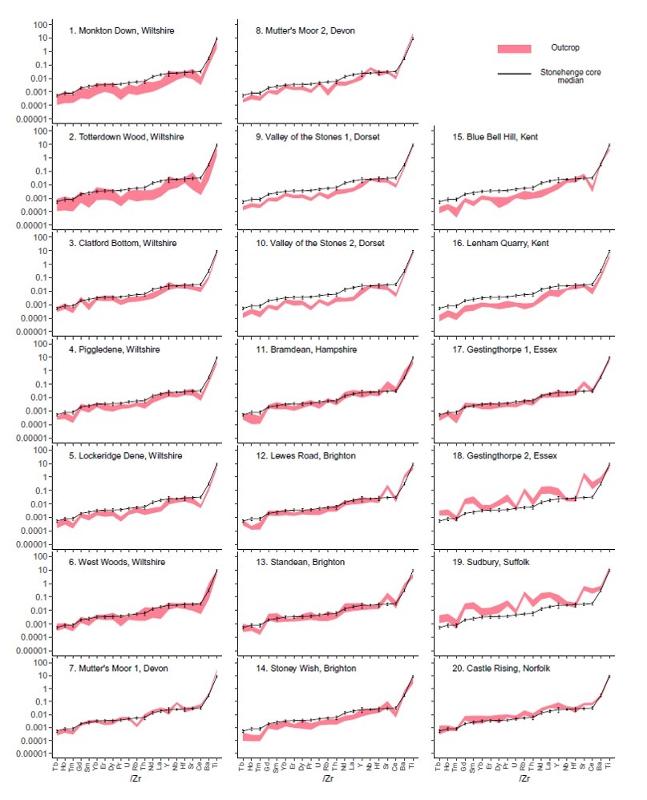
The graphs below from Fig 3 of Nash et al (2020) shows "Zr-normalized immobile trace element ratio data <that is, different element concentrations are divided by Zr concentration to normalize for correlated variations> for 20 sarsen localities across southern Britain and the Phillips' Core from Stone 58 at Stonehenge. Data ranges for each of the sarsen localities are indicated by the pink shaded region on each plot. The upper (lower) boundary for each area is defined by the maximum (minimum) Zr-normalized ratio calculated for each element plus (minus) 3 standard deviation of instrumental uncertainty. The solid black line is the median value for each Zr-normalized ratio from the three analyses of the Phillips' Core <that is, a sample from one of the sarsen stones at Stonehenge>. The maximum (minimum) error bars represent plus (minus) 3 SD of instrumental uncertainty."
Notice that this method of plotting takes into account variation both due to analytical uncertainty and due to variations in sample compositions from different locations.
Where did the smaller bluestones used to make the 5000-year structure at Stonehenge, England come from?
This puzzle comes from Richard E.Bevins, Rob A.Ixer, and Nick J.G.Pearce (2014) Journal of Archaeological Science Volume 42, Pages 179-193.
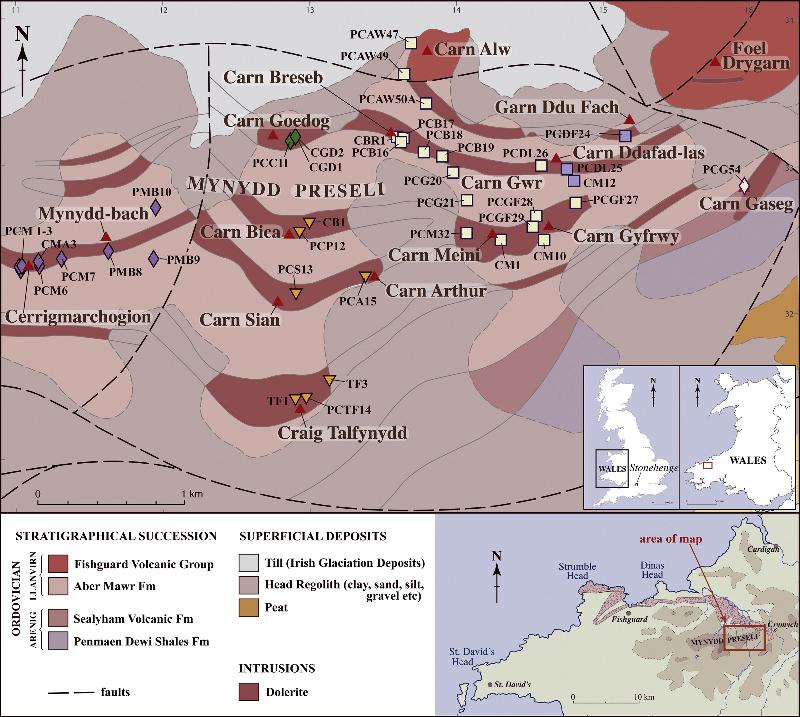
The map below from Bevins et al (2014) shows the location of dolerite stones than appear to be generally similar in type and appearance to the bluestones of Stonehenge. This region is much farther away than any of the sarsen stone sources.
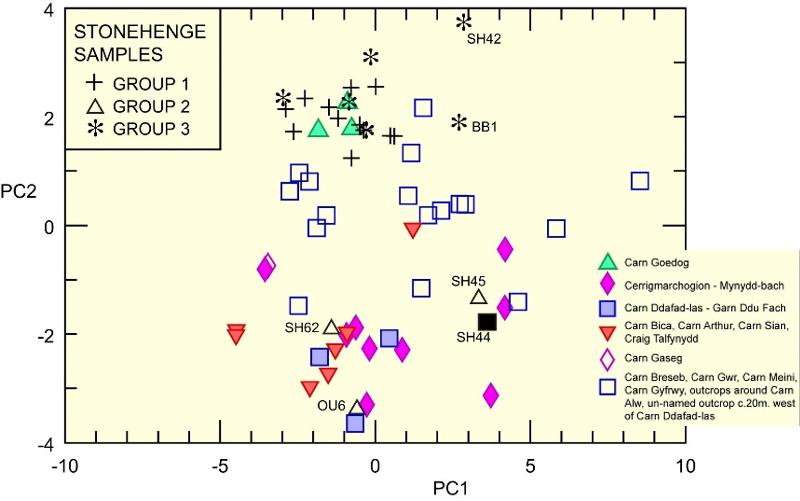
The graph below shows principle components for the dolerites and the Stonehenge bluestones plotted against each other. Principle components are a mathematical derivative of data based on statistical analysis of the concentrations of many elements in a large set of related samples. Principle components are an effort to find two or more variables (Principle Components 1 and 2) that do a better job of distinguishing between samples than would any two elements when taken by themselves. Principle components take into account how elemental concentrations vary with each other (remember how we divided by Zr in the study above in order to take out some of the variation?) So, for example, suppose that there is a 'component' in a set of related samples in which every time Zr varies by 10%, Ni will vary by 20% (and so on, for all elements). Now suppose that there is another component in which every time Zr varies by 10%, Ni decreases by 5% (and so on for all elements). Statistical methods can extract these components which allow us to plot many covarying elements on a single x-y plot like the one below. Groups 1, 2, and 3 are all from stones at Stonehenge. The other symbols show different dolerite samples in the vicinity of Mynydd Preseli over 200 kilometers northwest of Stonehenge.
last updated 8/6//2020. Pictures and data from published sources are indicated in the text. Other pictures and text are the property of Russ Colson.