Mineralogy-1- and 2-Component Phase Diagrams
Earth Science Extras
by Russ Colson
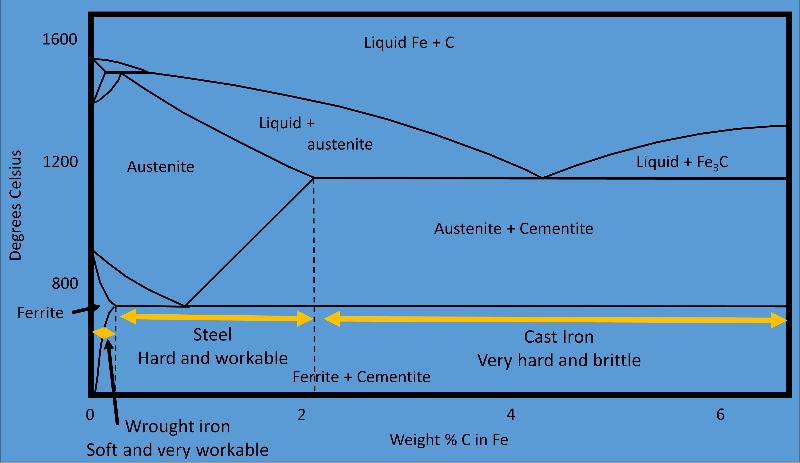
Phase diagram used to understand the manufacture of steel, a process begun over 3200 years ago. Manufacture of steel requires the formation of austenite and its recrystalliization at the eutectic into a mixture of ferrite and cementite.
Phase Diagrams, some preliminary terminology and concepts
A phase diagram is a graphical portrayal of reactions between phases as a function of parameters such as pressure (P), temperature (T), oxygen activity (Eh), acidity (pH), and other variables of a system that are plotted on the diagram. The phase diagram shows under what conditions that particular phases will exist (usually presuming chemical equilibium). Phase diagrams are a very powerful way to conceptualize and understand complex chemical systems in geology, water chemistry, metallurgy, ceramics, and many other fields. In this review, we are going to consider two types of phase diagrams: 1-component and 2-component phase diagrams..
Phases and Components
A phase is a macroscopically homogeneous material with distinct boundaries. Think about an ice cube (one phase) floating in a basin of liquid water (the liquid being a 2nd phase)
A component is a chemical entity, such as an element or compound, that may make up part of a phase.
Components and phases are not the same thing. For example, H2O might be a component, whereas water ice, liquid water, and water vapor are phases. H2O and NaCl might be two components, but salt water, which contains some of both components, would be a single phase.
Here's another conceptual illustration of differences between components and phases: A salt crystal (halite) might be a phase. A sucrose crystals might be a phase. Salt and sucrose crystals mixed together are still two phases because they are macroscopically heterogeneous and have different crystal structures and compositions. However, if we dissolve both halite and sucrose in water, we would have only a single phase (macroscopically homogeneous) with three components (NaCl, H2O, and C12H22O11). Notice that the 'salt' dissolved in the water is still the component NaCl, but it is no longer the phase halite (that is, no longer 'salt crystals').
Reactions in Phase Diagrams
Regions of a two-dimensional phase diagram show conditions where particular phase(s) is (are) present at equilibrium. Therefore the lines that mark the boundaries between regions where different phases are present represent a reaction from one phase to another as conditions change. For example, consider the two different phases of CaCO3, calcite and aragonite, shown on the 1-component phase diagram below.
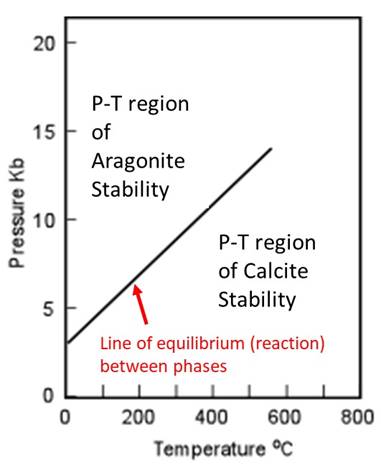
Regions marked as aragonite or calcite are conditions of temperature and pressure where those phases are stable. The line or curve between the calcite and aragonite stablity regions indicates the reaction in which the atomic structure of CaCO3 rearranges from one phase to the other. In other words, the line on the phase diagram is the graphical equivalent of the reaction below.
Calcite (CaCO3) ↔ Aragonite (CaCO3)
Aragonite has the same chemical composition as calcite, but a different crystal structure and therefore different entropy and enthalpy. There is a change in phase, but no change in composition. A 1-component phase diagram will show no change in chemical composition because there is only one component possible.
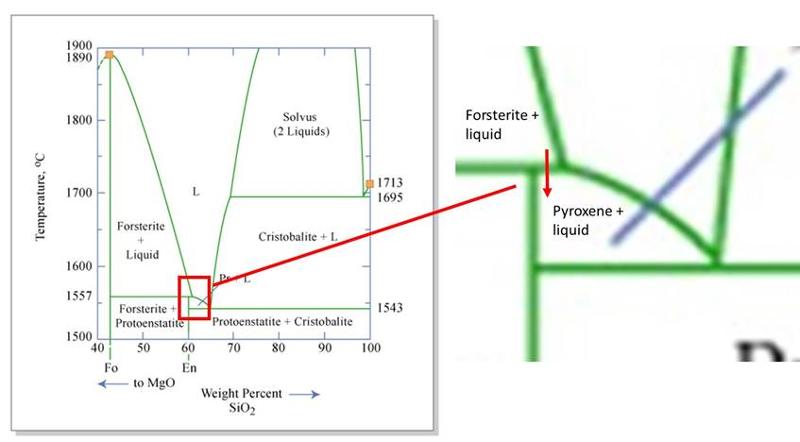
In contrast, in 2-component phase diagrams, a change in chemical composition can occur. For example, the line that runs between olivine and pyroxene in a Mg2SiO4 - SiO2 (2-component) phase diagram, highlighted in the illustration below, indicates where olivine backreacts with silicate melt to form pyroxene.
Mg2SiO4 (olivine) + SiO2 (in slicate melt) ↔ Mg2Si2O6 (pyroxene)
Two-component phase diagrams illustrate how melt or solid compositions can change with temperature, and show reactions between phases with different compositions, something that can't happen if only 1 component were present. We will look more closely at this phase diagram, and other 2-component phase diagrams, later in this lesson.
Degrees of Freedom
Where only a single phase is present in a 'region' of the phase diagram, we can infer that that phase can exist over the specified range of values of the variables plotted on the diagram, P and T for example. In other words, we can change one variable (say pressure) or the other variable (say temperature) and we still have the same, single phase present at equibrium. However, along a line, where at least two phases coexist, there is less room for variation. if we move off of the line, one phase or the other will be lost. This leads to the idea of Degrees of Freedom. Degrees of freedom are the number of parameters of the system that can be varied incrementally without changing the number or identity of phases present. Parameters might include things like pressure, temperature and composition of the phase(s) present.
The phase rule gives us a way to predict and understand the degrees of freedom. The phase rule is expressed as the following:
Degrees of Freedom = F = C + (other free parameters) - P, where C = the number of components, P = the number of phases, and the other free parameters are usually pressure and temperature (for a value of 2). If either pressure or temperature is held constant (such as in reactions in earth's atmosphere near sea level), then this value might be '1' rather than '2'. Under rare conditions where Earth's gravitational or magnetic fields are important parameters, these might provide addtional factors--however, they are rarely, if ever, considered in geological problems.
Phase Diagrams and Gibbs Free Energy
Since a line on a phase diagram represents a reaction, if follows that there must be a relationship between the energy of reactions and the locations of lines and phases on a phase diagram.
We can express the energy of a reaction (simplistically) as
ΔG = ΔH -TΔS +PΔV - RTlnK,
Where ΔG is the change in Gibb's Free Energy of the reaction, or G (products) - G (reactants)
ΔH is the change in enthalpy (or H products - H reactants)
T = temperature, typically in Kelvins
ΔS is the change in entropy (S products - S reactants).
P = pressure
ΔV is the change in volume of the reaction (V products - V reactants)
R is the gas constant
K is the equilibrium constant, which varies as a function of the chemical activity of the components in the phases, which depends on composition.
Work through the equation, thinking about what it means in the real world. Here are some key thiings to think about:
- A negative value for ΔG indicates that the reaction will proceed toward the products because the products have a lower energy state. Like a ball tends to roll downhill, chemical reactions also tend to move toward lower-energy states.
- Think about how changes in pressure (P) or temperature (T) will affect the reaction. Notice that it will depend on the changes in entropy and volume of the reaction.
- We can often think of the entropy as a measure of the degree of order or randomness in the system--larger values of S correspond to greater randomness. Thus, gases have higher entropy than liquids or solids. Notice that this is what is predicted by the equation above. Think through this until you 'get' it.
- Notice that if a reaction produces a decrease in volume (ΔV > 0), then the value +PΔV will be positive, and ΔG will be more positive. Since a more positive ΔG means that the reacton will shift toward the reactants, we can conclude that higher pressure shifts the reaction toward the lower-volume side of the reaction.
- Notice that if a reaction produces a decrease in entropy (ΔS > 0), then the value -TΔS will be negative, and ΔG will be more negative. Since a more negative ΔG means hat the reaction will proceed toward the products, we can see that higher temperature favors the phase with higher entropy.
- Enthalpy and the equilibrium constant (K) also affect the reaction, but we are not going to consider those in this particular lesson.
Understanding Density and Entropy from Phase Diagrams
Now consider the phase diagram and how it illustrates in a simple way how pressure and temperature affect the reactions.
Notice, if the temperature increases at constant pressure, as shown by the arrow, the reaction will proceed toward calcite ( the higher-entropy phase, and the reactants in the reaction above), as predicted also by the Gibb's Free Energy calculation
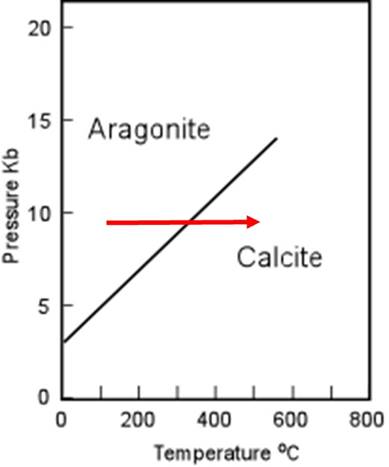
Notice if the pressure increases at constant temperature, as shown by the arrow, the reaction will proceed toward aragonite (the lower-volume and denser phase, and the products in the reaction above), as predicted also by the Gibb's Free Energy calculation.
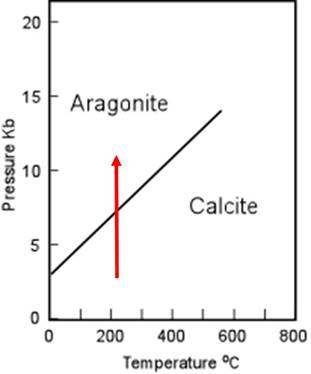
Interesting side note: Notice that aragonite is not stable at 1-atm pressure at any temperature shown. Yet we know that aragonite exists--being the main mineral in most mollusc shells for example. Living things can 'pump energy' into the system and manufacture a phase that is not the most stable. However, after burial, most aragonite shells will become unstable and recrystallize as calcite.
1-Component Phase Diagrams
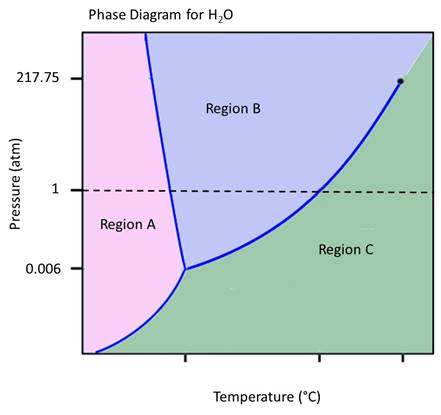
Reading a phase diagram is like learning to read a language--it takes practice. Let's practice reading the phase diagram for a material that we are quite familiar with--H2O. We are familiiar enough with the phases of water to relate what the diagram is saying to our everyday experience. (although, since this is a 1-component phase diagram, it's behavior is not exactly like what we see on Earth where other components, like N2 and O2 in our atmosphere change its behavior somewhat.
Reading phase diagrams--puzzle 2--click to solve
Reading phase diagrams--puzzle3--click to solve
Reading phase diagrams--puzzle5--click to solve
Reading phase diagrams--puzzle6--click to solve
Reading phase diagrams--puzzle7--click to solve
Based on the answer to the previous question, you might reasonably ask "But wait, if solid, liquid, and gas can't all coexist anywhere but at 0.006 atm pressure and 0.01 degrees C, then how can we ever have liquid H2O (like in the ocean), solid H2O (like in an iceberg) and gas H2O (like the water vapor in the air over the ocean and iceberg) at the same time?? (and we can know that the air contains water vapor if the water vapor is condensing out as rain or snow that falls on the ocean and iceberg!).
The answer is that the phase diagram shows only the conditions for a 1-component system--pure H2O. The water vapor in the air is not pure H2O, but rather is a mixture of H2O, N2, O2, Ar, CO2 and other trace gases. This changes the chemical activity of the gaseous H2O and allows it to coexist with solid and liquid H2O.
The Critical Point for H2O is also shown on the diagram, the point beyond which, at higher temperatures and pressures, liquid and gaseous H2O cease to be different phases and become a single, fluid, phase. This conditions is often reached in hydothermal system in the Earth's crust.
Reading phase diagrams--puzzle8--click to solve
Reading phase diagrams--puzzle9--click to solve
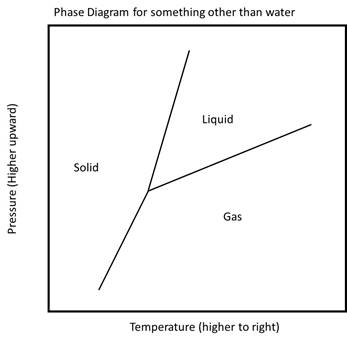
The phase diagram for water is actually fairly unusual. A more common phase diagram for many materials other than water, such as CO2, is shown below.
Phases are not limited to solid, liquid, and gas (or even plasma). In geological systems, you can find multiple solid phases and sometimes even multiple liquid phases in a single system. Consider the expanded phase diagram for H2O showing multiple different phases of ice (that is, ice with different crystal structures than the ice that we know at the Earth's surface).

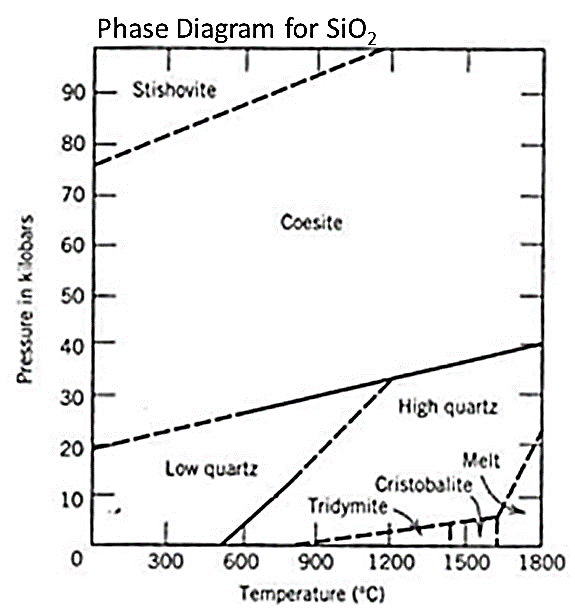
In the phase diagram below, there are no solid or liquid phases shown, only different solid phases of the same composition (but different crystal structures). This phase diagram is a key diagram in understanding and interpreting metamorphic rocks that formed under different conditions of temperature and pressure.
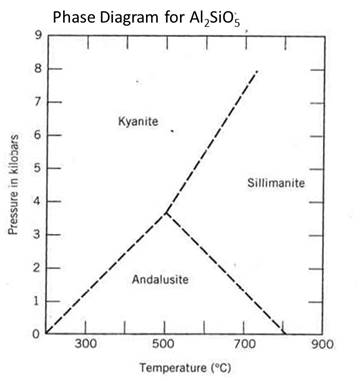
SiO2 is a common chemical component at the Earth's crust that can occur in a number of different phases.
2 Component Phase Diagrams with No Solid Solution
Two-component phase diagrams typically plot the compositional variation along the x-axis of the diagram and plot temperature on the y-axis. Pressure, then, is held constant, often at a value of 1-atmosphere pressure, although other pressures are possible. You can imagine that a phase diagram for a particular pressure represents a 'slice' through a three-dimensional diagram that includes pressure on a third axis coming out of the paper toward you.
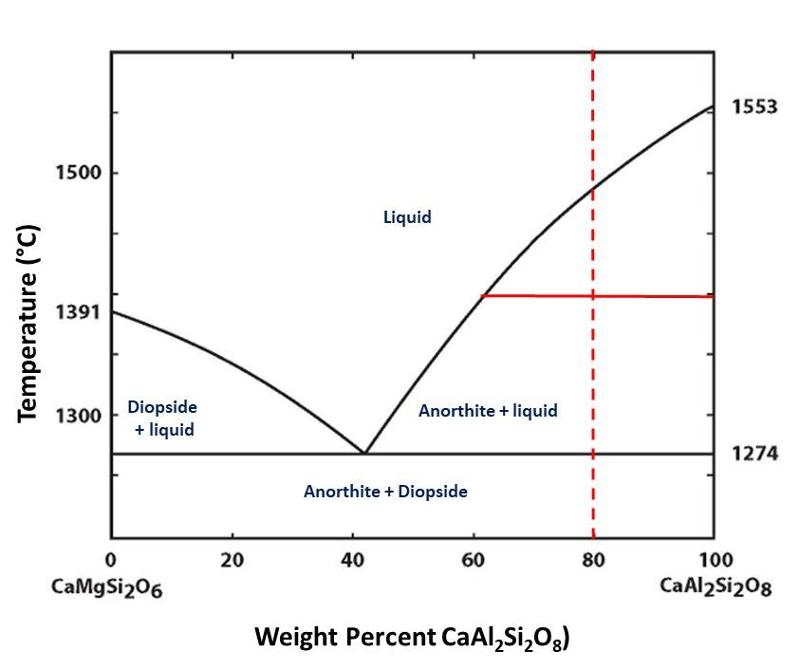
The diagram below illustrates several key parts of a 2-component phase diagram, including the liquidus and solidus lines, and the eutectic, each defined in the illustration. Study the diagram below for a few minutes. Be sure to notice what value is plotted on the X axis, and recognize that since there are only 2 components, the percentage of one component must equal 100 minus the percentage of the other component.
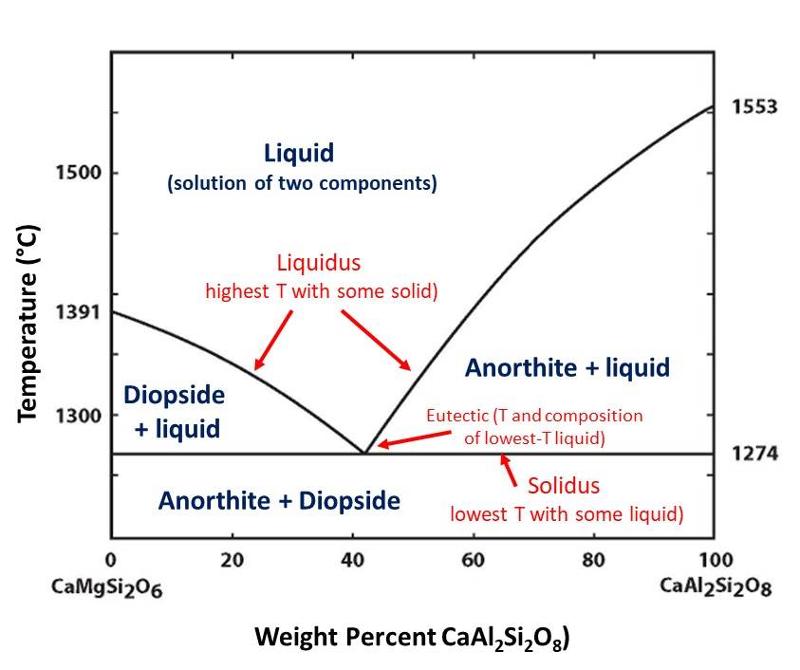
The two components of this diagram are CaMgSi2O6 (a diopsidic composition) and CaAl2Si2O8 (an anorthitic composition). As with the 1-component diagram, regions on the diagram show conditions (in this case, composition and temperature) where different phases are stable. The phases shown on the diagram include liquid (whose composition will reflect some mixture of the two components since, in this case, the liquid is a solution whose composition can vary), and the two solid phases diopside and anorthite whose composiitons cannot vary because there is no solid solution between diopside and anorthite. (actually, there may be some tiny solid solution, but so little that it does not show up on the diagram and has very little impact on the free energy or stability of the phases).
One prominent feature of this diagram is the way that the liquidus curves converge toward lower temperatures from the sides of the diagram toward the eutectic. For example, we can see that a melt of composition CaMgSi2O6 will freeze into diopside at 1391°C. However, if we add 20% CaAl2Si2O8 to the melt, diopside will not start to freeze until a temperature considerably below 1391°C is reached. The same reasoning applies to the anorthite side of the diagram, with the freezing temperature decreasing as we add more CaMgSi2O6 to the melt. This continues to the eutectic point, where both anorthite and diopside freeze out together.
Another way to think about this is that the liquid phase expands to lower temperatures when the composition is less purely one component or the other. We can understand this chemically by considering that diuting either end-component with the other component will decrease the chemical activity of that component in the melt and therefore require a lower temperature before the associated phase begins to crystallize. This can be seen by considering the reaction
CaMgSi2O6 (in liquid) ↔ Diopside.
Decreasing the chemical activity of the diopsidic component in the melt will cause the reaction to shift toward the left (by the Le Chatelier Principle). The composition of the diopside is fixed, since there is no solid solution, and therefore the chemical activity of diopside does not change with the composition of the melt. However, the proportion of CaMgSi2O6 in the melt can change, and as it decreases (becomes diluted), its chemical activity will decrease and the reaction will shift toward the left (by the Le Chatelier principle). If the equiibrium shifts toward the left, then we will need to lower the temperature further to intiate crystallization.
In the diagram below, the dashed red shows shows an example starting composition, often called the bulk composition to distinguish it from the different phase compositions.
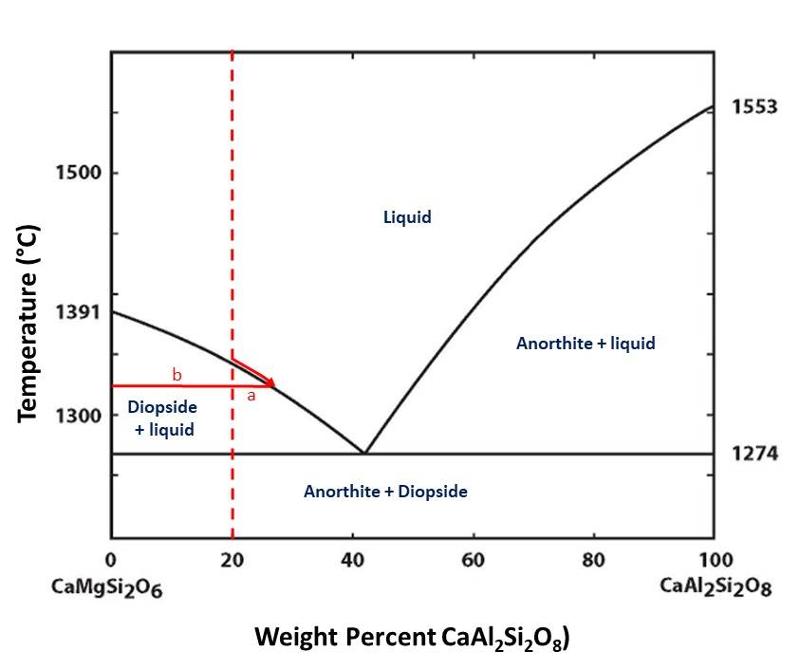
The composition of the diopside is fixed since there is no solid solution. This composition is quite different from that of the bulk composition, and that means that as diopside crystallizes from the melt, the composition of the remaining melt must become more enriched in the anorthitic component, as shown by the red arrow along the liquidus curve in the illustration above.
Because we don't change the bulk composition during equilibrium crystallization or melting processes (we are not creating or destroying atoms, only redistributing them among the phases present, and thus we have mass balance), the proportions of solid and liquid must be such that they add up to the bulk composition. This gives rise to the lever rule, shown below. (Technically, the lever rule holds for phase diagrams that plot weight % of components.)
The lever rule is
length a divided by the sum of a + b = the proportion of solid (in this case diopside).
length b divided by the sum of a + b = the proportion of liquid.
Notice that the length a increases with decreasing temperature, starting at 0 when we first reach the liquidus during cooling, to a maximum at the eutectic where we crystallize a mixture of both diopside and anorthite until all of the liquid is used up.
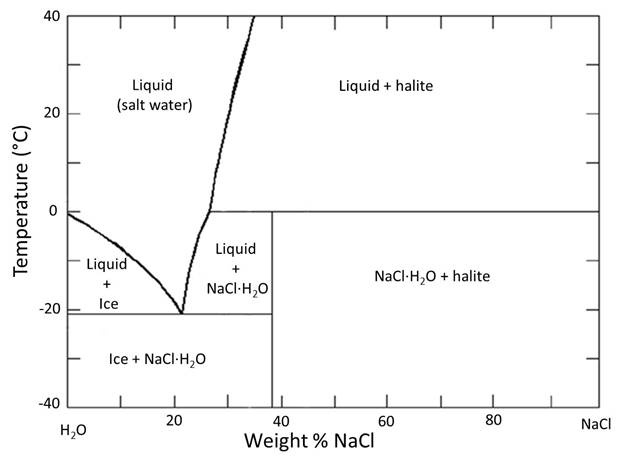
Let's do some exercises with reading a phase diagram using the phase diagram for H2O-NaCl. I am choosing to consider this diagram because there are a number of 'everyday life' observations which you can apply to understanding how to 'read' the phase diagram and what it tells us. It is a slightly more complex 2-component phase diagram in that there is more than one phase present on the NaCl-rich side of the diagram, but there is no solid solution for NaCl in ice. We are only going to consider the side to the left of the eutectic, which resembles the simple diagram above.
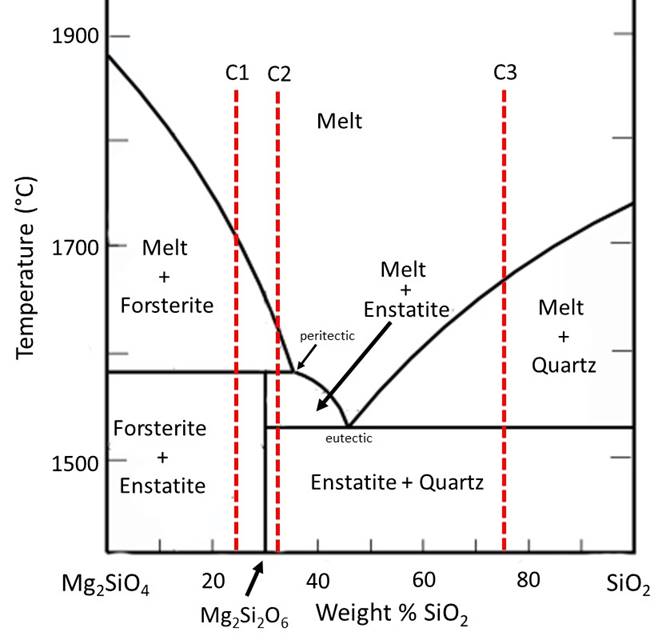
The following diagram shows an additional type of complexity possible in a 2-component phase diagram--a peritectic. At this peritectic, enstatite (Mg2Si2O6) melts with increasing temperature to become a combination of forsterite and melt--a process called incongruent melting where the solid melts to become a different solid plus melt. In this diagram, Forsterite is the Mg-rich end member of the Olivine solid solution. Enstatite is the Mg-rich end member of the low-Ca pyroxene solid solution. The high-temperature phases of SiO2 (cristobalite, tridymite) are not shown, and a 2-liquid immiscibility field is also omitted for simplicity. Temperatures for the eutectic and peritectic have been adjusted for greater ease in reading the diagram (and also so that you have to read the diagram, not simply look up answers online). See the diagram later in this exercise for more accurate temperatures for the peritectic and eutectic at 1atm pressure, and for the inclusion of the proper phases on the SiO2-rich side.
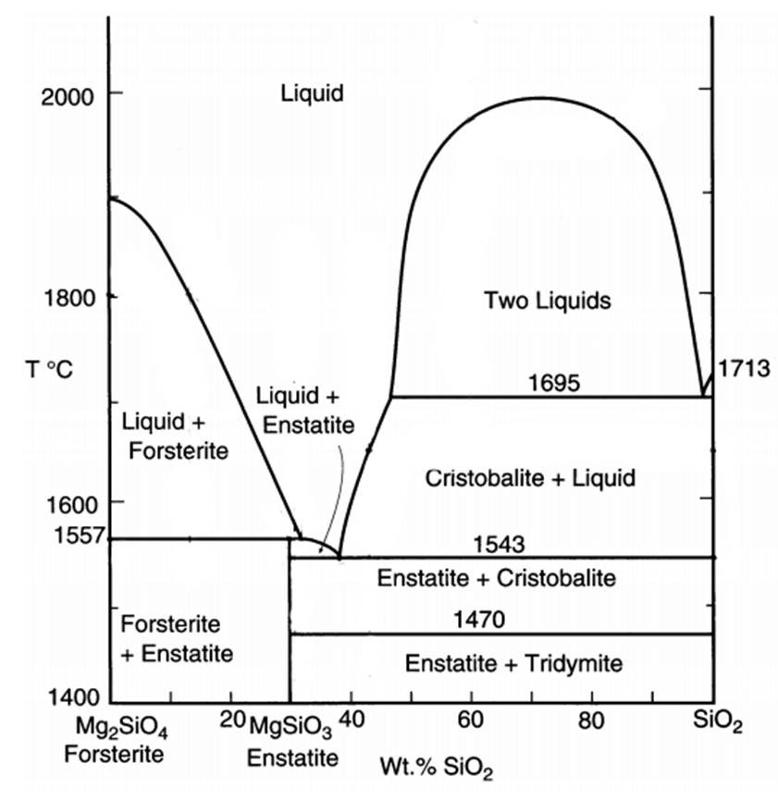
The diagram below shows more exact measurement for the peritectic and eutectic temperatures at low pressure, and also shows the field of two immiscible melts. The phase rule and lever rule also apply within the immiscible melt field. Bowen, of Bowen's Reaction Series fame, made many of the measurements reported in this diagram in a publication from 1914 (the diagram shown here is after Winter (2001) An Introduction to Igneous and Metamorphic Petrology
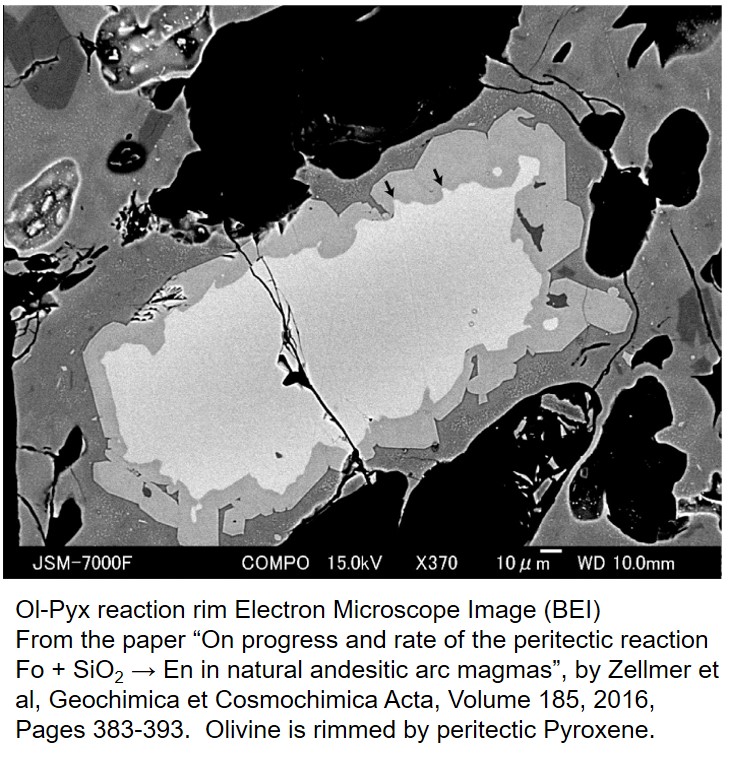
Phase diagrams can sometimes seem disembodied from the real world of rocks and minerals. However, it is important to make the connection between real world science and the portrayal of that science in the 'language' of phase diagrams. For example, the phase diagram implies that olivine should react with its own melt to produce pyroxene as temperature falls in a magma. This reaction might be manifest in a rock as an olivine crystal with a reaction rim that formed when the olivine became unstable. Olivine grains might even be rimmed by pyroxene, indicating the sequence in which the minerals crystallized from the melt. This type of reaction rim, with rimming pyroxene is shown in the image below from an electron microscope image. This image is from a paper published by Zellmer et al (2016) in Geochemica et Cosmochimica Acta.
2-Component Phase Diagrams with Solid Solution
In understanding the idea of solid solution, let's first consider an example of liquid solution--like a salt-water solution. In a salt water solution, we can add salt incrementally to water, making it saltier, without changing the phase that is present--it's still salt water. Likewise, there are some solids in which we can incrementally change the composition without changing the phase that is present. Examples of solid solutions include the following solid solution series:
Low-Ca pyroxene: Mg2Si2O6 to Fe2Si2O6
High-Ca Clinopyroxene: CaMgSi2O6 to CaFeSi2O6
Olivine: Mg2Si2O4 to Fe2Si2O4
Plagioclase feldspar: CaAl2Si2O8 to NaAlSi2O8
Garnets with a variety of cations on the A and B sites (A3B2Si3O12): e.g. (Mg, Fe2+, Mn)3(Al)2Si3O12 or (Ca)3(Al, Cr, Fe3+)2Si3O12
Taking olivine as an example, solid solution results when Mg and Fe mix with each other on the octahedral sites in the olivine crystal structure. The structure of the olivine does not change in character-- for example, the silica tetrahedra continue to not share corners, and the ratio of octahedral to tetrahedral sites and the ratio of tetrahedral sites to oxygen do not change. In general, to get solid solution, there must be similarity in size of the cations that are 'mixing' into the crystal lattice so that there is not too much distortion of the lattice. Thus, there is very limited solid solution between the pyroxenes Mg2Si2O6 and CaMgSi2O6, where the Ca is much larger than the Mg. Likewise there is limited solid solution between the garnets Mg3Al2Si3O12 and Ca3Al2Si3O12.
Example of complete solid solution
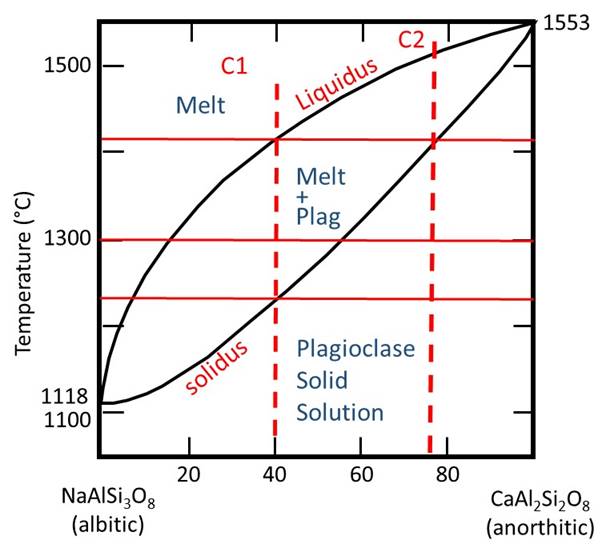
As our example phase diagram, we are going to consider the phase diagram for the plagioclase solid solution series.
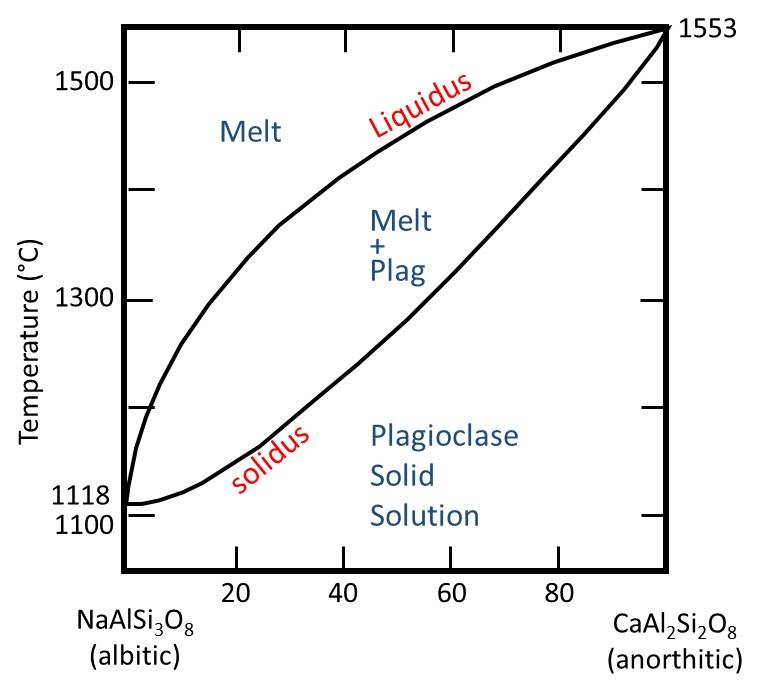
Drawing in some verticle bulk composition lines, plus some horizontal lines for different temperatures, gives us the following.
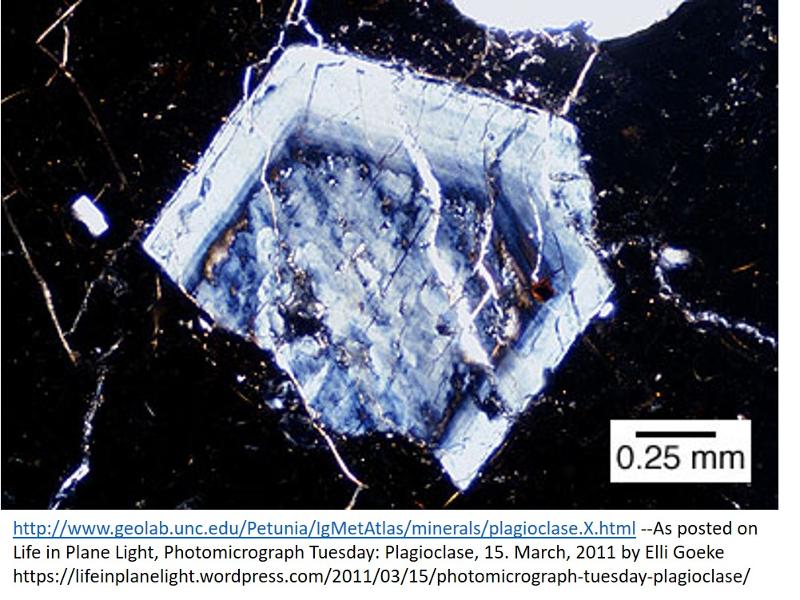
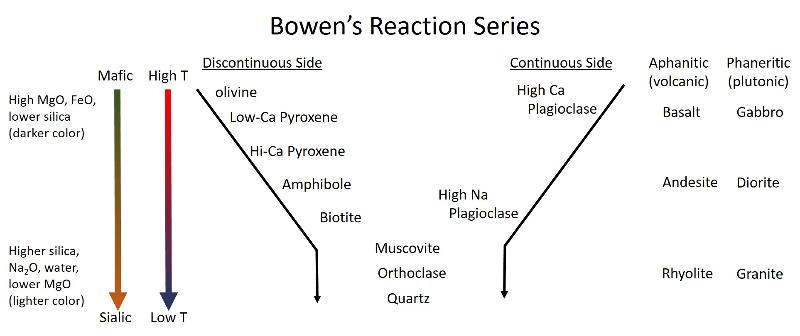
As mentioned previously, it is important to make the connection between phase diagrams and the real world of rocks and minerals. The solid solution series Anorthite-Albite is equivalent to the "continuous" side of Bowen's Reaction Series. It implies that both melt and plagioclase crystals should, in general, become more Na-rich as crystallization proceeds. Because the diffusion rate in plagioclase is slow (due to the coupled substitution that is required to charge balance either N(+1) or Ca (+2) in the crystal), it is rare for plagioclase crystals in the melt to remain in equilibrium. Therefore, the crystals are often zoned, for example with Ca-rich middles and Na-rich rims, as shown in the optical microscope mage below.
As mentioned, the phase diagram above is valid at only a single pressure. The diagram below shows how the plagioclase diagram changes with fluid pressure (from 1 bar to 5 kilobars fluid pressure).
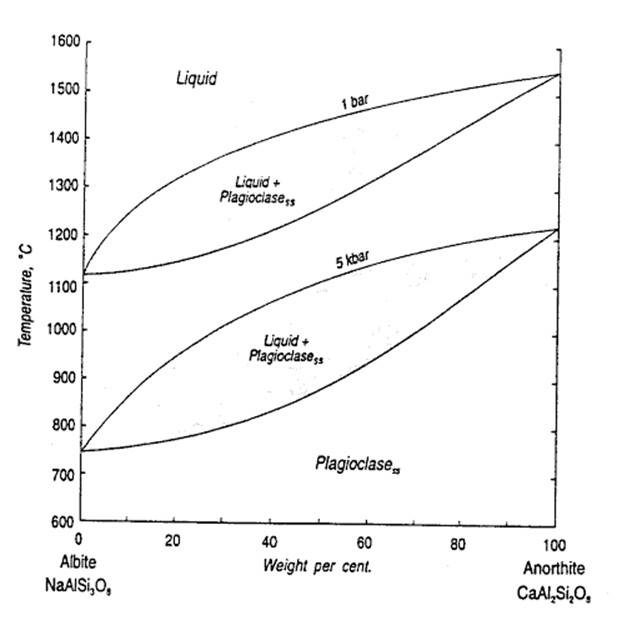
In this case, the shift with P is due mainly to the effect of fluids dissolving in the melt at higher pressure. Fluids like H2O decrease the tendency of the melt to polymerize--that is, form complexes of silica tetrahdra which share corners within the melt. Because plagioclase is a tectosilicate, which share all corners of the silica tetrahdra, this depolymerization makes the depolymerized melt more stable relative to the plagioclase crystals, and thus a lower temperature is required for crystallization. As we know from above, pressure can also favor the more dense phase, but in this case the density of the solid is not substantially less than the density of the liquid (although plagioclase may be less dense than some high-Fe natural melts).
Example of conditional solid solution
Soild solution is fairly complete in olivine and plagioclase, however, for other situations, solid solution may occur for only a limited range of compositions, or over a limited range of temperature or pressure.
We can look at the solid solution between orthoclase (KAlSi3O8) and albite (NaAlSi3O8) as an example. Because K is so much larger than Na, the two do not substitute for each other perfectly in the feldspar crystal structure.
In the simplified diagram below, phases other than Orthoclase (Or) and Albite (Ab), such as sanidine, microcline, high and low albite, etc, are not shown.
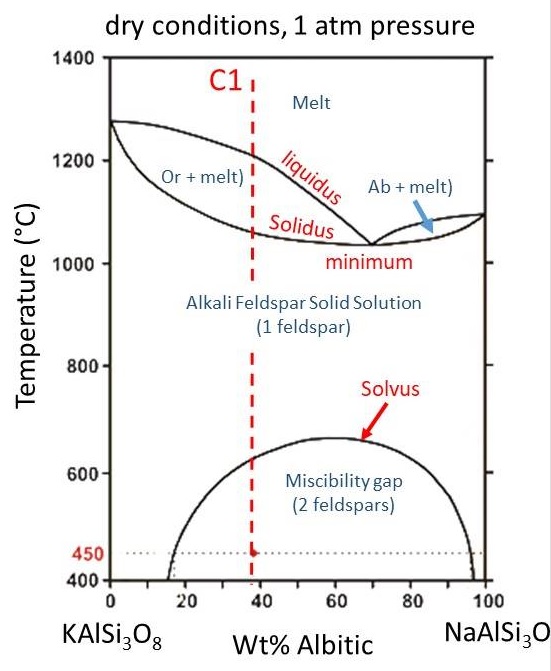
The solvus marks the boundary between immiscible solids below and solid solution above, in a similar fashion to how the solidus marked the boundary below which there is no liquid, and the liquidus marked the boundary above which there is no solid, Thus, there is a region where a single feldspar of intermediate composition will form and then a region at lower temperature where that single feldspar will exsolve into two separate feldspars. This is the origin for perthite--an intergrowth of orthoclase and albite shown below.
Althernating bands of lighter and darker color are exsolution lamillae of albitic (Na-rich) and orthoclase (K-rich) feldspar. This characteristic intergrowth is called perthite. Individual bands in this image are about 1mm in width.
The liquidus and solidus curves for the orthoclase-albite phase diagram are analogous to the liquidus and solidus curves on the anorthite-albite diagram with the exception that there is a temperature minimum in the Or-Ab diagram, with two fledspar+melt elipses on either side of the minimum.
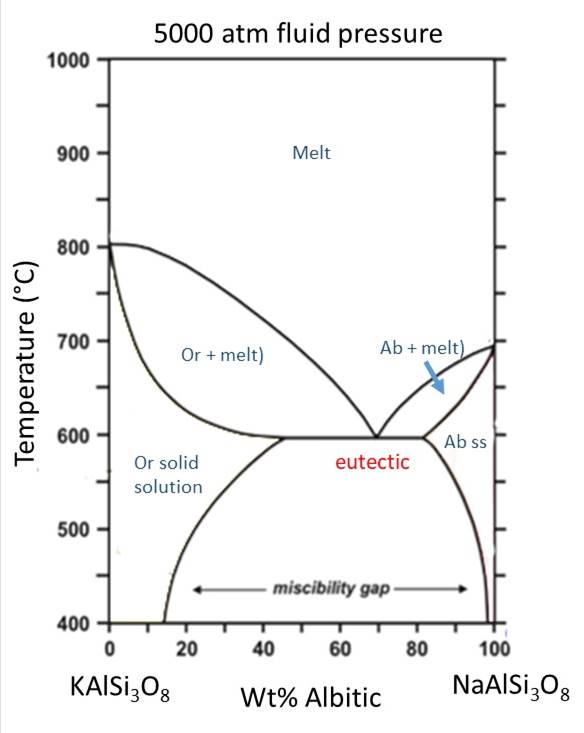
In a similar fashion to how increasing water (fluid) pressure lowered the liquidus and solidus curves for the anorthite-albite solution, shown above, increasing water (fluid) pressure decreases the temperature of the liquidus and solidus curves for orthoclase and albite. This causes the lquidus and solidus curves to intersect the solvus, cutting out the region where complete solid solution exists between Or and Ab. Thus, at high fluid pressure, two feldspars will form from the beginning, instead of only a single feldspar that later exsolves to form perthite. Presence of two feldpars in a granite thus tells us about the conditions of fluid pressure during crystallization.
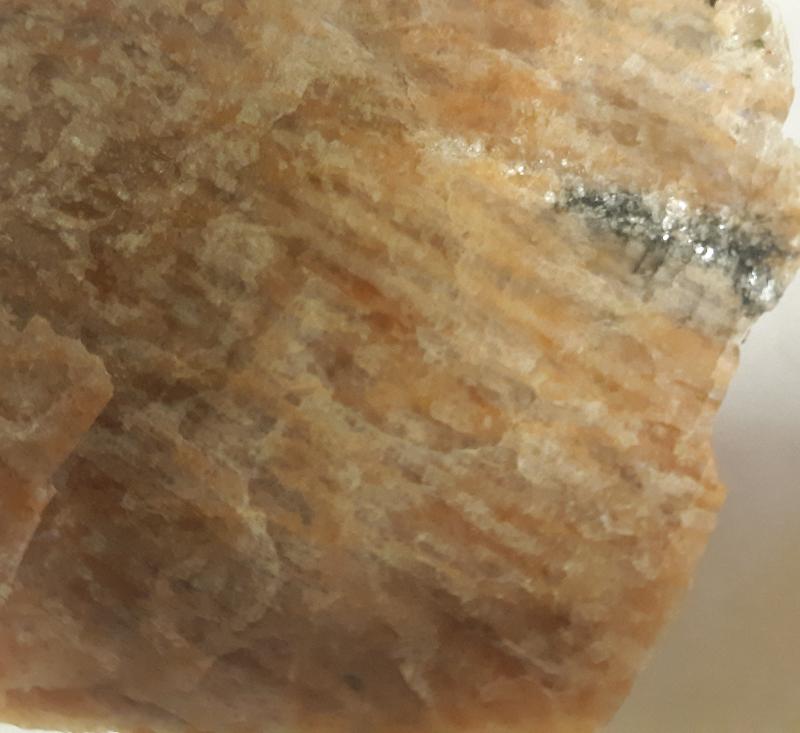
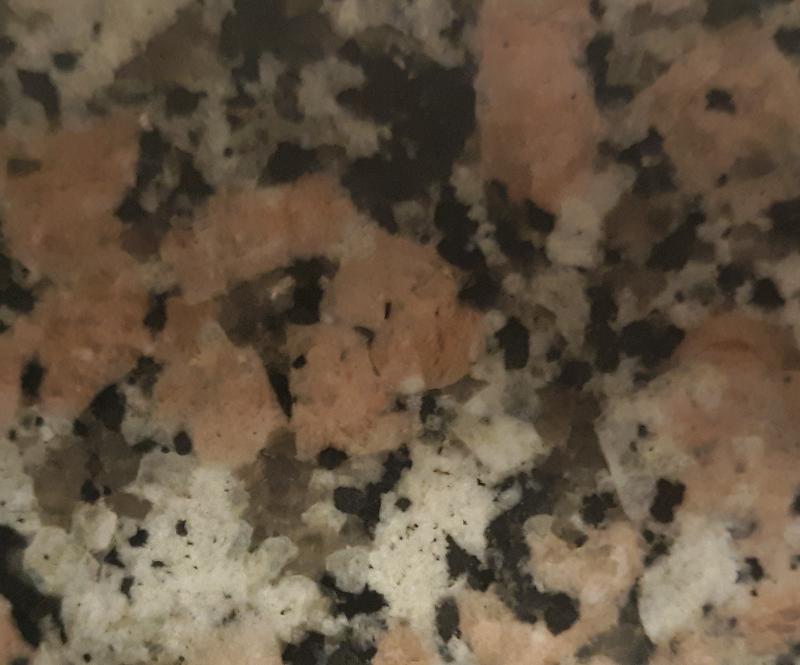
Below is a picture of a granite with two distinct feldspars, a white Alibitic (Na-rich) fledspar and a pink Orthoclase (K-rich) feldspar. Crystals are 5-10 mm wide.
Bowen's Reaction Series
Bowen's reaction series illustrates a number of key ideas in igneous petrology and is useful for every geologist to know and understand. Bowen was an experimental petrologist, one of the first to begin constructing phase diagrams from experimental data, and constucted the series based on his experimental work with phase diagrams. Study the illustration below and try to make connections with the phase diagrams that we have examined in this review.
last updated 12/19/2020. Text and pictures are the property of Russ Colson except for the base phase diagrams modified from a variety of sources, and as noted in captions for microscope images.