Change in Stars--Interactive Text
Earth Science Extras
by Russ Colson
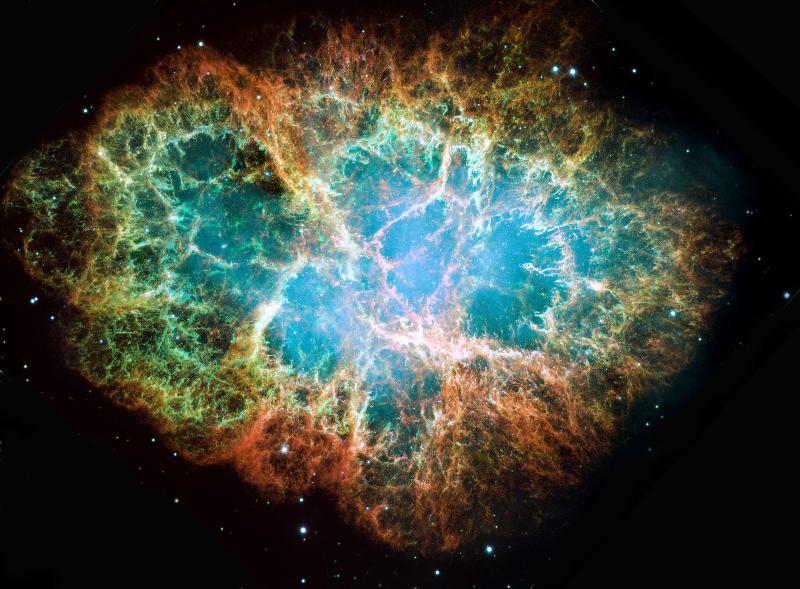
Crab Nebula, The Hubble Space Telescope, StSci-PRCos-37.
The Crab Nebula is the remnant of a supernova that was observed in human history in 1054AD. One account from a Chinese astronomer is the following: "I humbly observe that a guest star has appeared; above the star there is a feeble yellow glimmer... it had appeared at dawn, in the direction of the east, under the watch of Tiānguān (天關, Zeta Tauri). It had been seen in daylight, like Venus. It had rays stemming in all directions, and its colour was reddish white. Altogether visible (during the day?) for 23 days."
It's also possible that the supernovae was observed by North American Pueblo people and recorded in a pictograph (Brandt, J. C. & Williamson, R. A. "The 1054 Supernova and Native American Rock Art" (1979), Journal for the History of Astronomy, Archaeoastronomy Supplement, Vol. 10, p.S1). As of this writing, you can find a picture of the pictograph at https://www2.hao.ucar.edu/Education/SolarAstronomy/supernova-pictograph
Recap of Lecture
The Life Cycle of Stars--A literature review investigation
One of the most important aspects of learning science is to do scientific investigations. An investigation involves making observations in the natural world, identifying a question you want to examine further, making more focussed observations and doing experiments, organizing the experimental and observational data into graphs, tables, and illustrations, interpreting the data, inferring a model that explains the observations, testing the model against new observations, explaining the model to others, and arguing from evidence that the model provides a reasonable and correct interpretation of reality.
All of this requires a lot of time and mentoring and is hard-to-impossible to do in an on-line class.
However, a different type of investigation is where you investigate scientific ideas that other people have already figured out and explained--we might call it a literature review investigation or even an "online" investigation-- this type of investigation, although not a scientific investigation, also has value in the world. It's also valuable to gain practice in figuring out the difference between reliable information online and less reliable information (or sometimes, even complete junk). We are going to do an investigation of this sort.
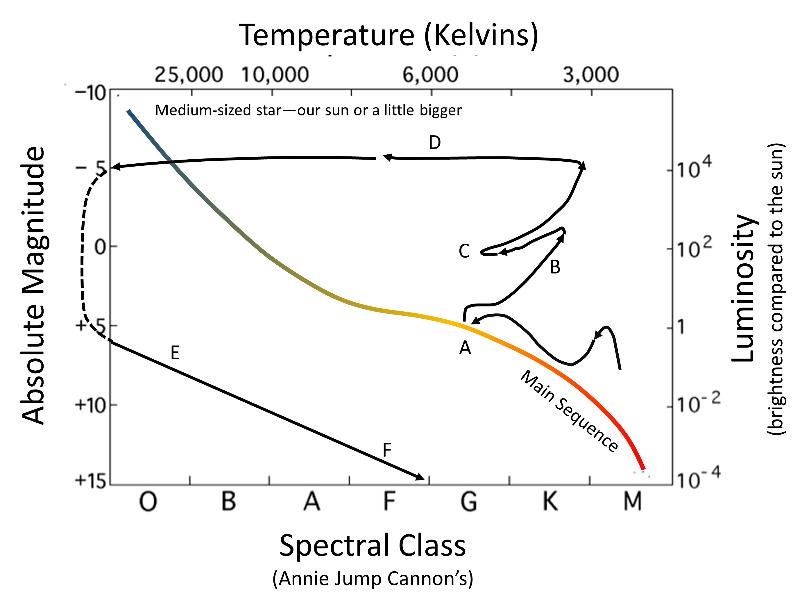
Learn all you can about the life cycle of stars. We will be considering in particular 1) stars perhaps slightly larger than our sun and 2) stars much larger than our sun whose ultimate destiny is to go out in a supernova. Key search words to help you find important info might be stellar evolution (or star life cycle) and Hertzsprung-Russell diagram.
When you think you are ready, test yourself against the two questions below; the first qustion is for smaller stars perhaps a bit bigger than our sun and the second for bigger supernova-destined stars. There are a lot of pieces to these questioins so don't rush through them. There are some complexities to the lifecycle of stars dependent on exact size and chemical composition, so the illustrations below have been simplified to illustrate key changes and transitions.
Nucleosynthesis refers to the process of making elements (synthesizing nuclei), and is a major consideration in the life cycle of stars, which you probably encountered in your online researches. The major process that often shows up in the study of the life cycle of stars can be simplified as the "alpha process", basically adding an alpha particle to elements to create heavier elements, by reactions such as those shown below (an alpha particle = 2 protons and 2 neutrons = the nucleus of a He atom). For elements lighter than Argon, the reactions below are a composite, and the actual mechanism for these reactions is thought to involve fusion of C with C and O with O, and thus be more complex.

and so on up to 
In the notation above, which you probably also encountered in your online researches, the letter is the symbol for an element (e.g. C = carbon). The number in the upper left is the atomic mass = number of protons plus number of neutrons. The number in the lower left atomic number = the number of protons (which defines an element--carbon always has 6 protons). Notice that each successive element formed by this process has 2 more protons and 2 more neutrons, making the atome mass increase in increments of 4.
This process can't make elements heavier than Iron (Fe). Heavier elements, and elements whose protons and neutrons don't increase in even steps of 2. must be formed by other processes. Many heavier elements are probably formed in supernovae (you may have encountered the idea of 'r' processes in your online searches, where a rapid flux of neutrons, such as might be generated by a supernovae, create heavier elements and isotopes).
Thus, nearly all the elements of our solar system--nearly all the elements in your body--were made in the hearts of stars. We really are all made of stardust!
Figuring out the Life Cycle of Stars
Spectroscopy, newly possible in the 1800's, opened the door to learning about star temperature and what stars are made of. However, the thrill of classifying stars was found in its potential to provide insight into how stars change through time. To a significant extent, the life-cycle pathways for different sizes of stars which we examined in the lessons above were based on mathematical calculations of rates of nuclear reactions, temperature, pressure and brightness of stars inferred from a theoretical understanding of nuclear physics. However, in science, theoretical modeling must be based on, tested by, and calibrated against observations in the real world. For the life cycle of stars, these observations include the proportions of different star types that we see in the observable universe.
We can figure out the lifecycle of stars, not by watching one star go through its life cycle, but rather by observing groups of stars in different life stages.
Conceptual introduction:
Suppose that you have a tube, like the one shown below. Every two minutes you poke a marble in one end and a marble pops out the other (steady state...same number of marbles in the tube and same distribution of marbles in each zone). You can see how the distribution of marbles in the tube allows one to estimate how long a marble spends in a particular part of the tube.
Applying the "marbles in the tube" illlustration to human populations
Suppose you arrived on earth and noticed three different types of human, which you call small, large, and slow. You watch for two years, and observe that one of the slow humans dies each year (you infer those must be old humans) and one small human is born each year (you infer those must be the young humans) Suppose that this population has reached a steady state, that is, each year one death is balanced by one birth, and that the proportions of each type of human is as shown below.
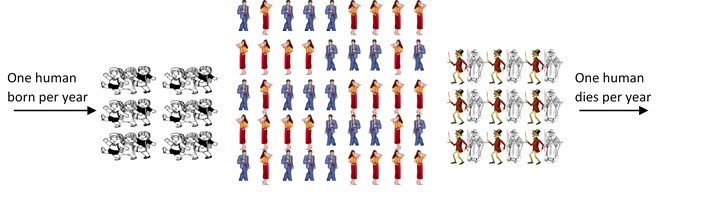
Determine the time spent at each stage of life, in years.
Of course, people are more complicated than this, not always maintaining a steady state population (that's what baby booms are about) and not always living exactly the same length of time (not for lack of trying). Stars are also more complicated. It took more than a century after Jesuit priest Angelo Secchi began classifying stars to figure out the life cycle of stars.
Applying the "marbles in a tube" illustration to a case where steady state has not yet been reached:
Consider a slightly more complicate version of the marbles-in-a-tube puzzle. Again assume that a new marble is inserted every 2 minutes. It's clear that steady state has not been reached in the case below because the system has not been continuing long enough to reach the end (in nature this can only be realized if you have some means of determining the what the end truly is, like the death of a star by a known or anticipated process). Even though you don't have a steady state, you can still infer a number of things.
Applying the "marbles in a tube" illustration to a simulated study of the life cycle of a sun-like star
The puzzles below use simulated data, simplified to consider only stars of the same mass or age. There are many more types of stars than discussed below, which made the real puzzle much more challenging. Tens of thousands of studies, some taking entire careers, were needed to solve the puzzle of stellar evolution.
Suppose we looked at stars with the same mass and chemical composition characteristics as our Sun (or a little bigger). We pick a set of stars that we think might represent a population in which new stars have been born somewhat regularly over a long period of time (steady state at least for stages that have been completed in the population of stars). For the population of stars we have chosen, we find the distribution of stars as given below.
A: There are 1 million sun-like stars, burning H in their core, with a new one born every 9 thousand years
B: There are 111 thousand red giants, burning H in a shell outside of the core
C: There are 11000 yellow giant stars burning He in their core
D: There is 1 planetary nebula star
E: There are 900 thousand white dwarf stars
F: There are no black dwarf stars
 \
\
Reverse Data Simulation of the Life Cycle of Larger Stars
Large stars go through a much different, and shorter, life cycle ending in a supernova instead of a white dwarf. For example, a star with a mass more than 18x our sun, such as a star that went supernova in 1987 in a nearby galaxy called the Large Magellanic Cloud, is believed to have the life cycle as listed below:
Inferred life cycle of SN-1987A type II supernova
1) entered Main Sequence 11 million years ago
2) left Main Sequence 700,000 years ago (becoming a Red Supergiant)
3) Began He fusion in core 650,000 years ago (Red and Blue supergiant)
4) He fuel exhausted 45,000 years ago
4) Began Carbon fusion 12,000 years ago
5) Supernova in 1987.
Now, figure out how many stars might be in each of the stages below in a galaxy the size of the Milky Way, using the life cycle data above, and from the knowledge that, based on Chinese star records, there have been perhaps 20 supernova in the Milky Way galaxy over the past 2000 years (the last one visible to the naked eye occuring in 1604AD).
An Age of Star Cluster Puzzle
As seen in the models for the life cycle of stars above, bigger stars are much shorter-lived than smaller stars. A star cluster is a group of stars that were all 'born' about the same time. By looking at what stage of life different stars in the cluster are in, we can figure out the age of the star cluster.
A couple of spectrum puzzles
Remember from the lecture that absorption and emission lines from specific elements are superimposed on a star's overall blackbody radiation signature. Lines are specific to elements, but also dependent on temperature. It is on the basis of the spectral lines that Annie Jump Cannon developed the star classification that we use today.
The black body radiation spectrum of a star can tell us its temperature. Below is the spectrum of our Sun (with absorption and emission lines smoothed out). Based on black body radiation, estimate the temperature of the surface of the Sun. (To interpolate the peak wavelength accurately, you may need to convert the lower scale to logarithms. Also, don't be sloppy--use a ruler).
Here is a reminder of how logarithms work:
1m = 100cm = 1000mm = 1,000,000μm = 1,000,000,000nm = 10,000,000,000Å
log 102= log 100 = 2; log 103 = log 1000 = 3; log 10000 = 4, etc. log 102.5 = log 316 = 2.5
The X axis tic marks on either side of the peak are the following:
103Å = 102nm
1um= 103nm
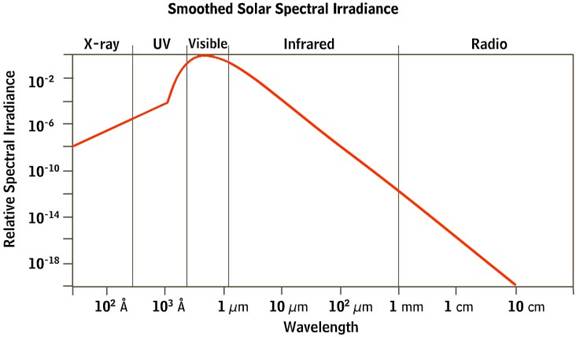
Image source unknown.
last updated 4/23//2020. The image of the Crab Nebula comes courtesy of NASA, ESA, J. Hester. Images whose source is not known are indicated in the text. Other text and pictures are the property of Russ Colson.
