Aqueous Geochemistry: Ore Deposits
Earth Science Extras
by Russ Colson
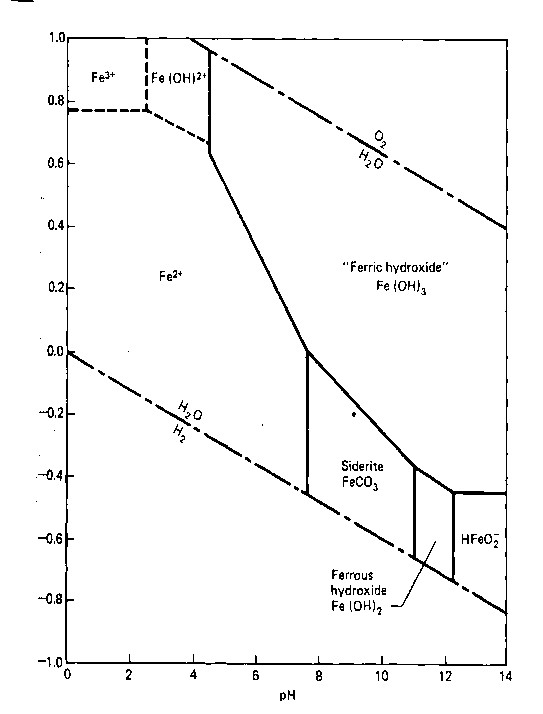
The Previous lesson examined how to interpret and understand an Eh-pH phase diagram such as the one below for iron. In the lesson below, we will examine how phase diagrams can help us understand the formation of ore deposits of iron and aluminum. As a reminder, here is the Eh-pH diagram for iron that we considered in the last lesson.
Iron Ore Formation
In a very broad way, the iron phase diagram can help us explain why banded iron formations such as those of Minnesota only occur in rocks formed between about 2.6 and 1.8 billion years ago (bya).
Banded Iron Formations (BIFs) are the primary source of iron ore on Earth.
Consider the reaction from above:
Fe(OH)2 (Ferrous, soluble) + H2 + 1/2O2 ↔ Fe(OH)3 (Ferric, insoluble) + H+
Based on this reaction, if oxygen increases, will iron become more or less soluble? Notice that the phase diagram portrays the same dependence of the reaction on Eh (oxygen) and pH (H+) as is inferred by considering the Le Chaterlier Principle.
The time from 2.6 to 1.8bya is a period when cyanobacteria and blue-green algae had started to oxidize Earth's oceans, at least in local regions. We might imagine, for example, colonies of photosynthetic life producing higher oxygen conditions along those shores where nutrients from land feed colonies of photosyntheitc life and oxygen accumulates in the relatively shallow water.
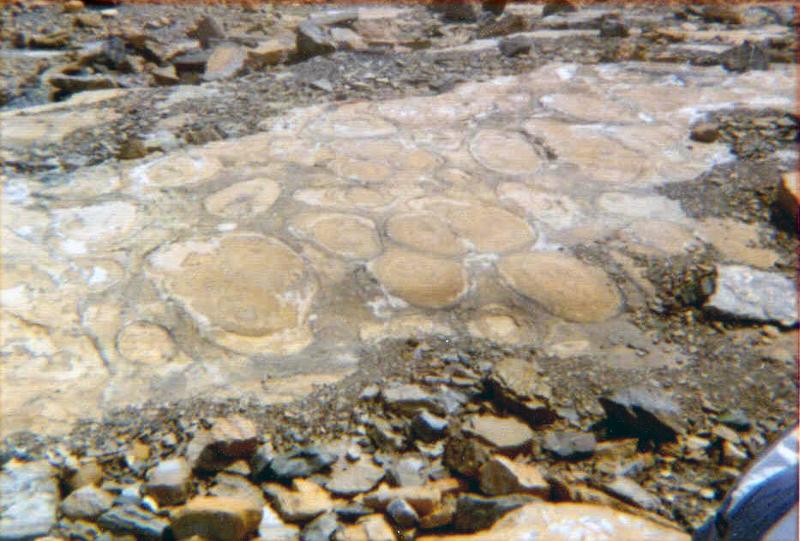
Below are fossil stromatolites, cyanobacterial colonies from Precambrian times, seen in rocks in Glacier National Park.
While photosynthetic activity might have increased oxygen in localized regions, oxygen in the wider ocean may have remained at lower values. During this time, iron could dissolve in the relative oxygen-poor ancient ocean, be transported towards the shores in the form of soluble ferrous firon, where higher oxygen levels would oxidize the iron, forming insoluble precipitates of ferric iron, which would become the iron deposits for future humans. Before 2.6 bya, there wasn't enough oxygen around to precipitate the iron. After 1.8 bya, there was so much oxygen everywhere that not enough iron could dissolve in the oceans, and therefore the iron could not be transported to the coastlines where photosynthetic life was concentrated. Thus, the period between 2.6 bya and 1.8 bya gives us a sweet spot in which we could get both ferrous and ferric iron in large quantities.
The geological associations of many BIFs appear to suggest that iron may have been deposited as Iron hydroxide or iron oxide in a shallower environment at the same time that iron carbonate (siderite, FeCO3) was being deposited in an adjacent, deeper, depositional environment. This type of simultaneous deposition in adjacent environments is called a facies relationship. Find the line in the phase diagram for iron that represents the reaction between iron hydroxide and iron carbonate. Think for a moment what the diagonal slope of this line implies about the dependence of this reaction on Eh (oxygen) and pH (H+).
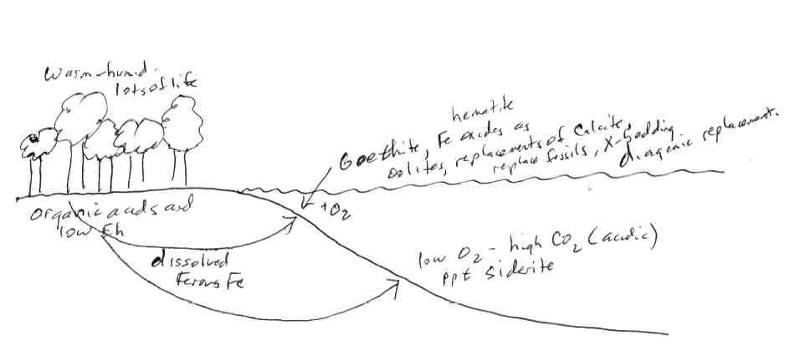
Below is an illustration of the facies relationship between Iron oxides/hydroxides and iron carbonates in ironstone deposits (Fe deposits that formed in more modern rock and are generally smaller in size than the BIFs). In the ironstone deposits, iron is made mobile by the presence of organic matter that causes reducing conditions. The reducing conditions result in ferrous iron which is soluble and leaches through the sediment until it is either oxidized or converted to carbonates where it encounters open water. Notice the chemical conditions in the deeper water. Confirm that they match with the expectations from the phase diagram.
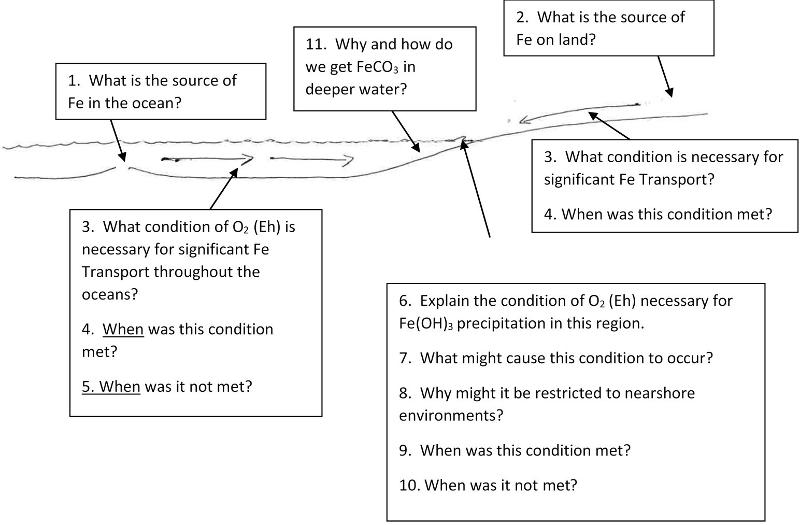
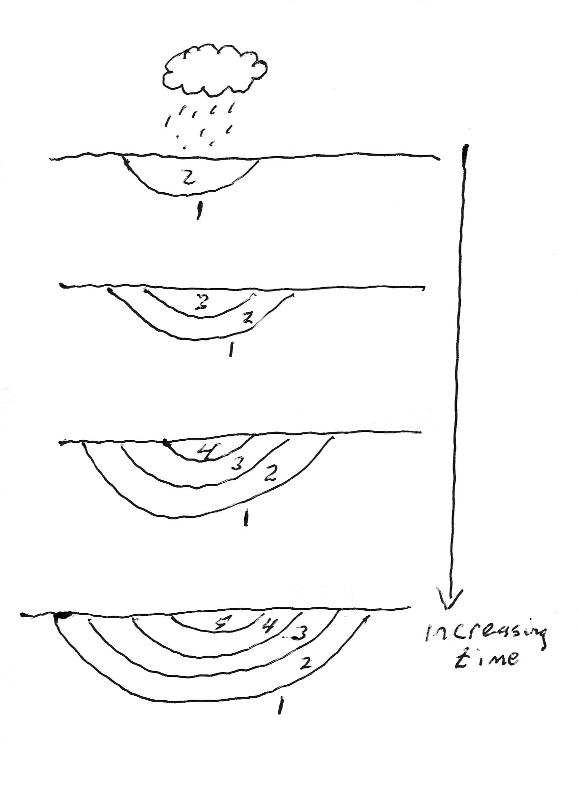
For the following question, consider the simplified model for the formation of BIFs shown below. This is a pictoral illustration of the BIF model described above.
An Environmental Extra
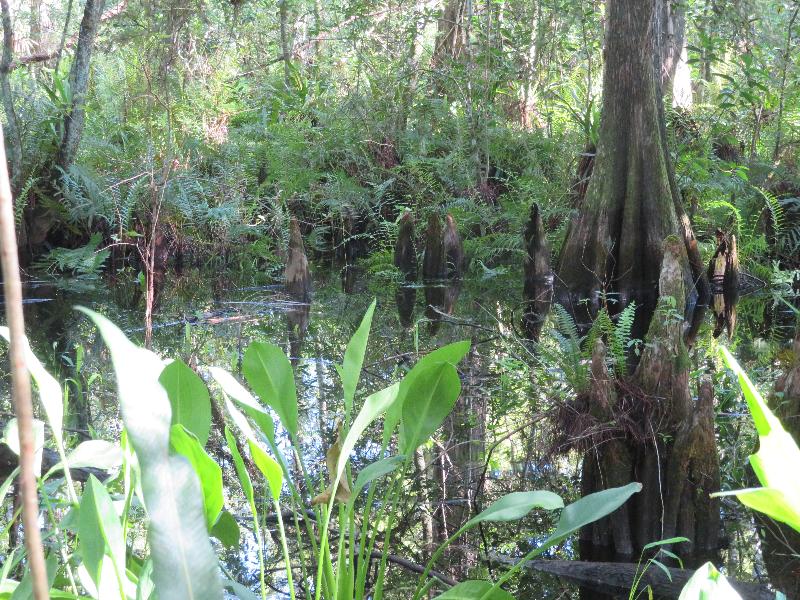
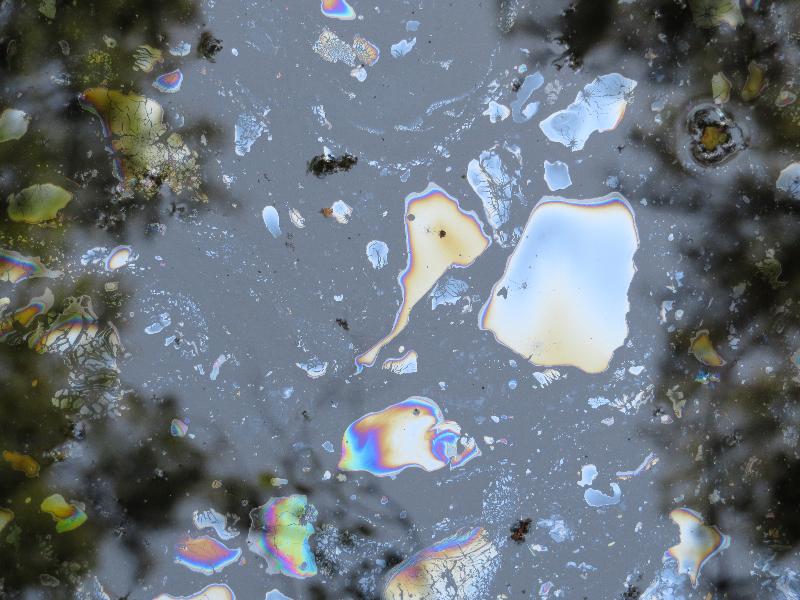
More geologically-recent iron ore deposits (much smaller than the BIFs deposited in the ancient past) are often associated with swamps, where organic material produces conditions where iron can dissolve in water in a reduced (ferrous) state. Here's a different application of our growing understanding of the chemistry of iron in water. Below are some pictures that I took in Corkscrew Swamp in Florida in 2021 while visiitng my son. Corkscrew swamp includes perhaps the largest stand of old-growth bald cypress forest in the world. Notice that the pictures show colored patterns on the surface of the water that look like oil slicks. The rainbow colors are the result of thin-surface diffraction--my son who teaches physics at nearby FGCU also took pictures of this feature for use in his lessons on optics!). However, this oil-slick-like feature is not evidence of environmental malfeasance--it is a natural phenomenon. Can you postulate an explanation for this feature using your understanding of iron chemistry in water?
Bald Cypress with knees in Corkscrew Swamp, FL
Reflections in a pool in Corkscrew Swamp, with diffraction pattern due to a thin surface coating on the water.

Diffraction patterns from several surface coatings in a pool in Corkscrew Swamp, FL
Al Ore Formation
Most ore deposits on Earth form when a particular element dissolves from a large volume of rock, is transported it to a new location, and precipitates into a relatively small volume of rock, thus concentrating it. This requires mechanisms to dissolve the element (such as reducing iron to a ferrous state, as discussed above), transport the elements (such as movement with ocean currents in the simplified BIF model above), and then precipitate it (such as the oxidation of iron to a ferric state along shorelines in the BIF model above).
Aluminum ore deposits generally form differently. Al is so remarkably insoluble,that it is difficult to transport it in large enough quantities to form an ore deposit. Instead, to produce an Al ore, we dissolve away everything else, leaving the Al behind in a concentrated deposit.
In general, solubility of cations increases as the size of the cation increases and the charge decreases, thus, abundant cations might be listed in order of increasing solubility as
Al3+, Fe3+, Si4+, Mg2+, Fe2+, Ca2+, Na+, K+
Si doesn't necessarily fit the pattern, being small and highly charged, but it is somewhat soluble in the form of silicic acid (H4SiO4).
In an environment with lots of rainfall, like a tropical rain forest, the more soluble cations like K+, Na+, and Ca2+, are often quickly leached from the soil, leaving other cations more highly concentrated. The concentration of Fe3+ in soil with lots of rainfall is why the soils of the southeastern US are so red colored.
High levels of acidity can increase the solubility of most elements and increase the amount of leaching. Because an abundance of plant life often creates lots of organic acids and carbonic acid, the conditions in a tropical rain forest can produce extreme leaching, removing even the Fe2+, Mg2+, and finally the Si4+ from the soil (this process is aided by organic chelating agents, which we are not going to consider here). This leaching of so many elements destroys those minerals that have a high capacity to store nutrients and so results in highly infertile soils, which, if the top layer of organic residue is lost, become very hard and useless for farming. This is part of the concern for burning of tropical rain forests for agriculture--once a few years have past, the organic matter on the surface is lost and the remaining soil, having most of the elements leached from it, is very infertile.
In the most extreme cases, nearly everything is leached from a tropical soil except for the most insoluble aluminum hydroxides. These are then usable as aluminum ore.
We can understand the concentration of Al ore by considering a phase diagram.
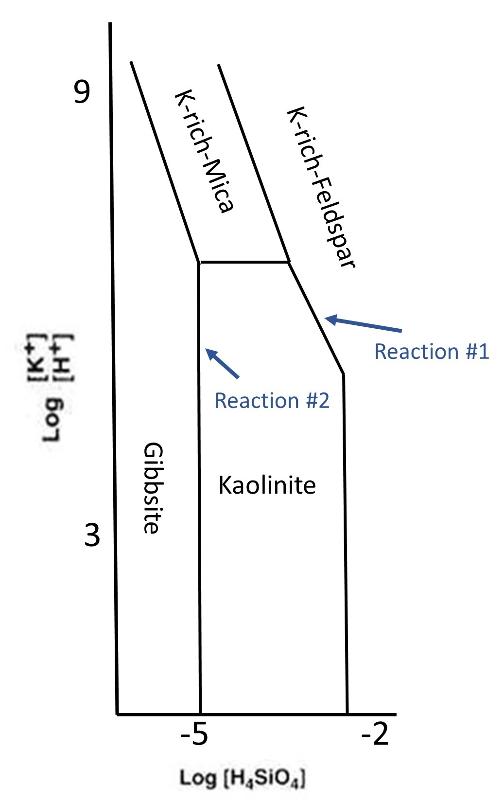
Diagram is based on Feth et al, 1964
Two key reactions for the formation of tropical soils and Al ore deposits are shown on the diagram above. Be sure to notice that the Y-axis includes two cations, K+ and H+, with H+ in the denominator, meaning that higher H+ will plot lower on this axes and higher K+ will plot higher. The X-axis plots silicic acid (H4SiO4), with more silicic acid to the right. Using the Le Chatatlier Principle and your understanding of phase diagrams, infer the character of these two key reactions.
Let's think about what happens as acidic rainwater leaches down through rock that contains K-rich feldspar. The rain water will leach away easily dissolved elements like K+, so the concentraiton of K+ in the developing soil will decrease. Also, the water will leach away the H4SiO4 that is in solution, decreasing its value as well. This will continue until the conditions reach the reaction #1 line on the phase diagram. At this point, K-rich feldspar will begin to decompose to form kaolinite. However, in the process of decomposing to form Kaolinite, K-rich feldspar produces both K+ and silicic acid. Therefore, this reaction will buffer the concentrations of K+ and silicate acid in the soil. Another way to say this is that, as long as both Kaoliinite and K-rich Feldspar are present in the soil, the conditions of H4SiO4 and K+/H+ in the soil are constrained to stay along reaction line #1 (presuming equilibrium conditions).
Once all of the K-rich feldspar is reacted away, the leaching process will again decrease the K+ and silicic acid and conditions with move to the left through the Kaolinite stablity field. This will continue until conditions reach reaction line #2. At this point, Kaolinite will begin to react away to form Gibbsite. This process will again produce more silicic acid, and so the sililcic acid concentraton will be buffered along the reaction #2 line until all of the Kaolinite is gone. Once the Kaolinite is gone, the silicic acid can continue to decrease and conditions will enter the Gibbsite stablity field. Notice that K+ is not buffered by the reaction that forms Gibbsite from Kaolinite, and so concentration of K+ in the soil would either become vanishing small, or be controlled by some other minerals that we are not considering here.
The phase diagram below shows one path that conditions might take as such a soil develops.
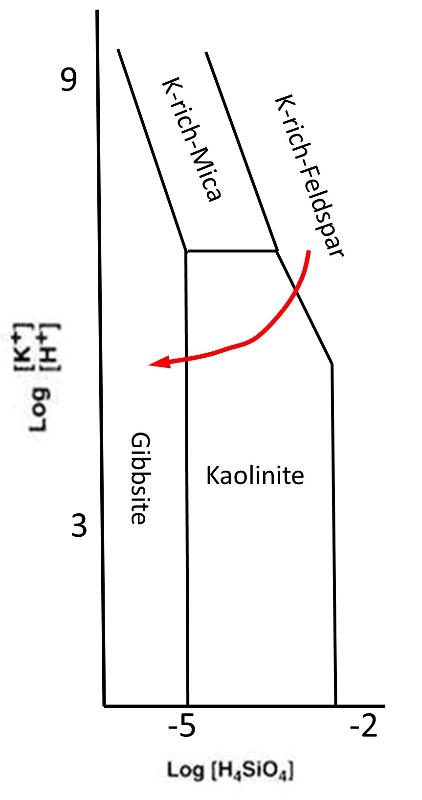
Consider the progression of soil development through time in the soil horizon model below. Based on the phase diagram and the red model arrow, think about which soil horizons will contain K-rich feldspar,Kaolinite and Gibbsite.
last updated 7/20/2021. Text and pictures are the property of Russ Colson.