Material Properties--Experimental Interpretations
Earth Science Extras
by Russ Colson
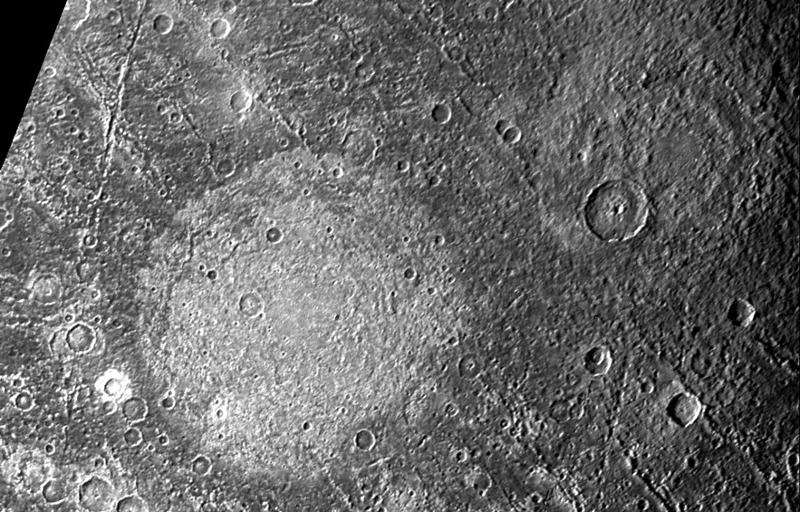
The bright spot on Ganymede, moon of Jupiter, seen in the image above from the NASA Galileo spacecraft, is Memphis Facula, a palimpsest, sometimes called a 'ghost crater.' It is an albedo feature (light reflection) that lacks significant topographic expression, presumably because of elastico-viscous movement over long periods of time in which the icy crust, which would be elastic over short time frames, flows over longer periods of time to level out the topography. The smaller crater to the upper right, Nidaba, is a younger crater and retains some of its topographic expression, although still less than the smaller and younger craters around and within it.
Review of Different Properties of Materials
There are several ways that a material can deform under a given stress (force per unit area). These include elastic, plastic, viscous, elastico-viscous, and elastico plastic deformations. These behaviors are a function not only of the composition of the material, but of temperature, pressure, water content, and deformation rate as well. These material properties are not only important in building bridges or skyscrapers, but they influence mountain rainges, impact craters, plate tectonics, soil creep, earthquakes, lava flows, and many other planetary processes and features. We are going to go through a brief overview of several different material properties.
Elastic Deformation:
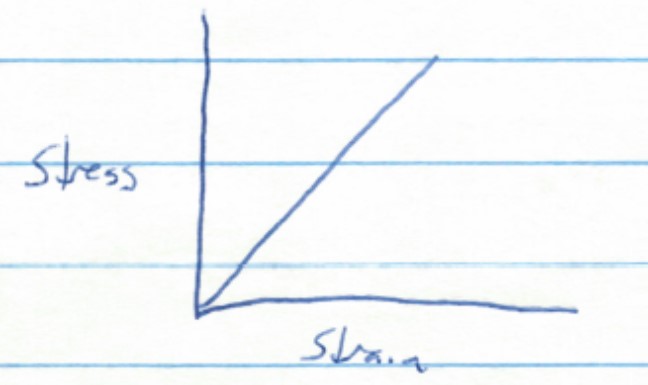
Elastic materials exhibit a correlation between stress (the force per unit area acting on a material) and strain (the deformation of a material under that stress) that is linear. As stress increases, strain will increase in a proportional, linear fashion. LIkewise when stress is decreased, strain will decrease in a linear fashion. "Springy" materials are examples of elastic behavior. A sketch graph of elastic behavior (values increasing away from the origin) is shown below.
To store energy for earthquakes, rock must be elastic, stretching elastically until it breaks and that energy is released as the rock 'springs back.'
Plastic Deformation:
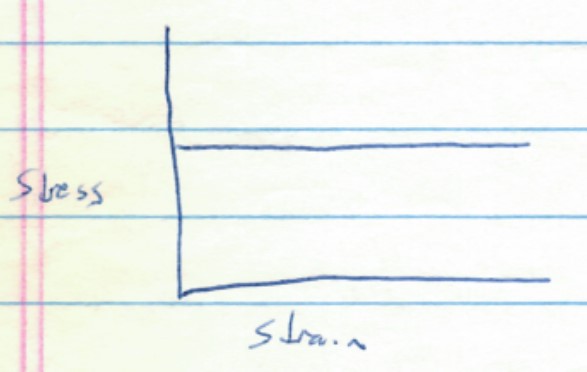
Plastic materials exhibit a behavior in which the material resists stess without deformation up to a critical 'threshold' at which point the material deforms infinitely without further resistance. Toothpaste is often close to a plastic material, resisting flow to a point and then behaving like a liquid above that stress point. Also, styrofoam is somewhat plastic--when you push on it, it resists to a point but squishes permanently once a strength threshold is exceeded. A sketch graph of plastic behavior (values increasing away from the origin) is shown below.
Elastico-Plastic Deformation
Most materials behave with a combination of elastic and plastic properties, with elastic deformation up to the threshold strength, and then plastic deformation thereafter, as shown in the stress-strain diagram below.
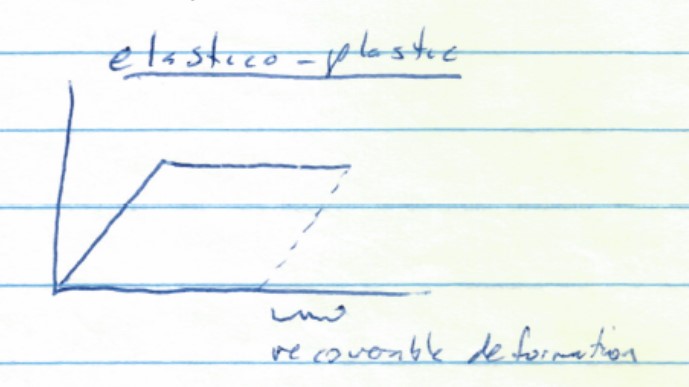
A paperclip deforms this way. When you push on it a little in a shear (sideways) direcction, it will stretch and then spring back. However, if you push it too far, it will permanently bend and only spring part way back when the stress is released.
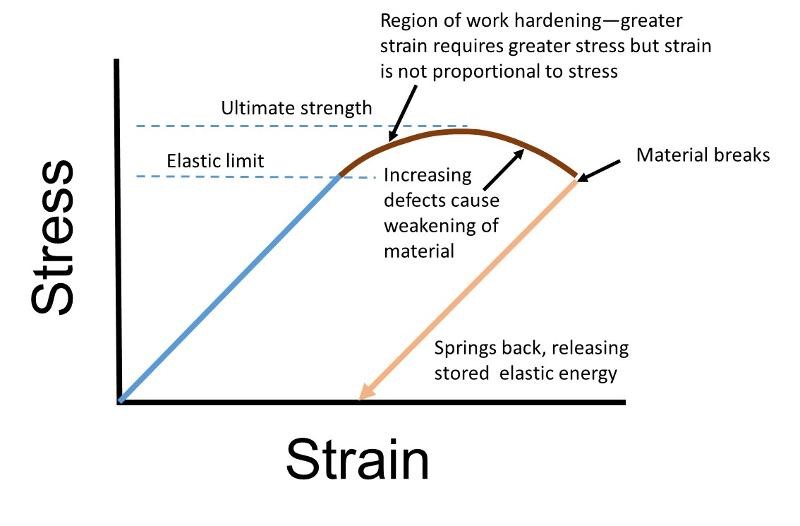
Commonly, when a material like a paperclip begins to deform plastically, atom-level fractures in the material will initially increase the material strength (more resistance to stress) as the tiny fractures prevent layers of atoms from easily sliding past each other. However, as the number of tiny microfractures continues to increase, they ultimately will begin to weaken the material, and eventually the material may break. Many structural materials, like steel, behaves in this fashion. The increase in strength after initiation of plastic deformation is called work hardening. This is shown below.
Rocks also behave elastico-plastically, with the degree of elastic and plastic behavior dependent on temperature (T), pressure (P), and composition of the material.
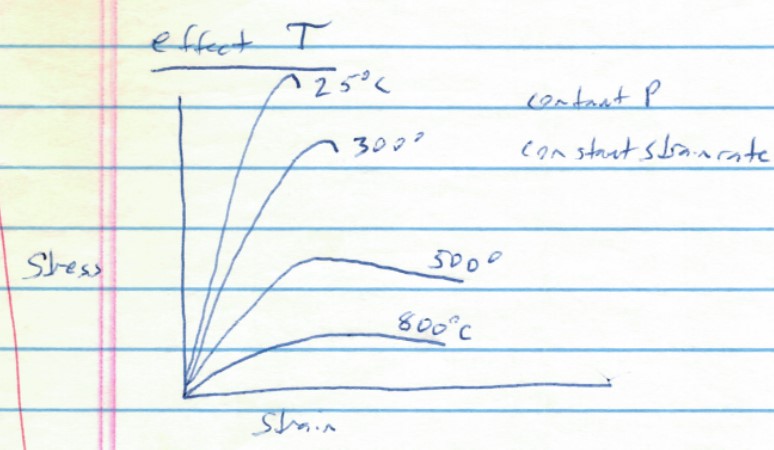
The stress-strain diagram below shows conceptually the effects of temperature on elastic and plastic behavior. Study the graph to figure out what it is saying about how rocks (and many other materials) behave as a function of temperature.
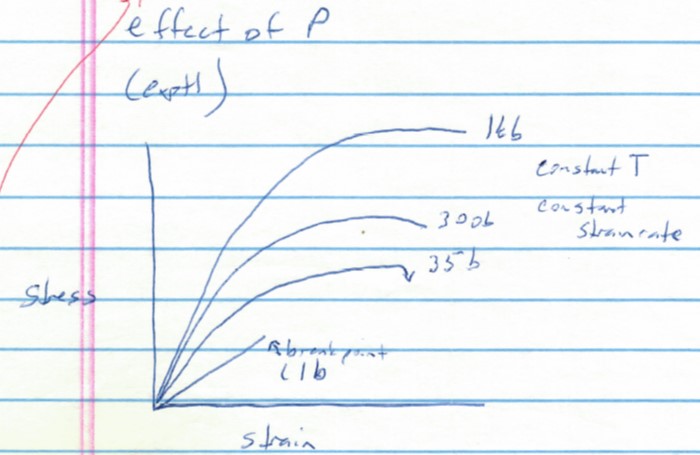
The stress-strain diagram below shows conceptually the effects of pressure on elastic and plastic behavior. Study the graph to figure out what it is saying about how rocks (and many other materials) behave as a function of pressure. (1 kb = 1 kilobar = 1000 bars of pressure; 35 b = 35 bars of pressure, 1 b = 1 bar or about 1 atmosphere of pressure)
Viscous Deformation
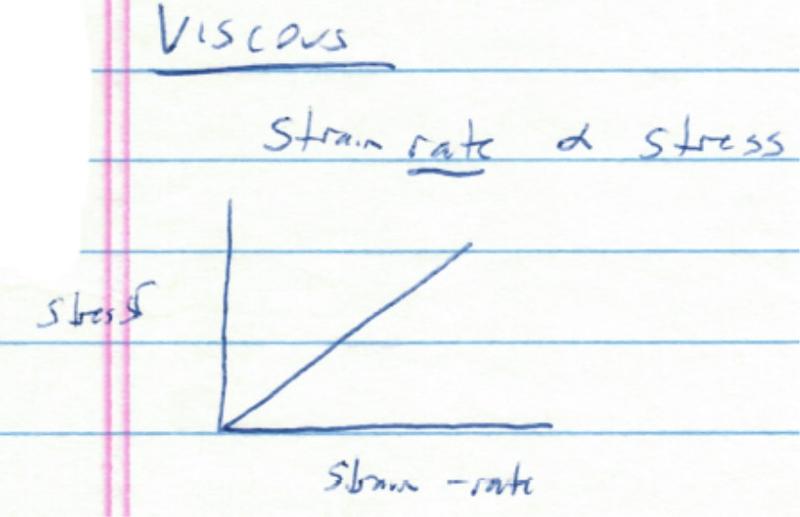
Viscous deformation is where a material deforms infinitely under any stress, and there is no threshold strength as with a plastic material. Most liquids, such as silicate, water, or other composition lavas, are viscous fluids. For a Newtonian fluid (which I am going to refer to in this lesson as a 'true' viscous material), the deformation rate is proportional to stress as shown below. Water is an example of a Newtonian fluid in which deformation rate is proportional to stress. For example, if I am trying to walk underwater, my velocity will be directly proportional to the force I apply. In addition to Newtonian viscosity, there are a variety of non-Newtonian deformation properties. The graph below is for Newtonian fluids.
Elastico-viscous Deformation
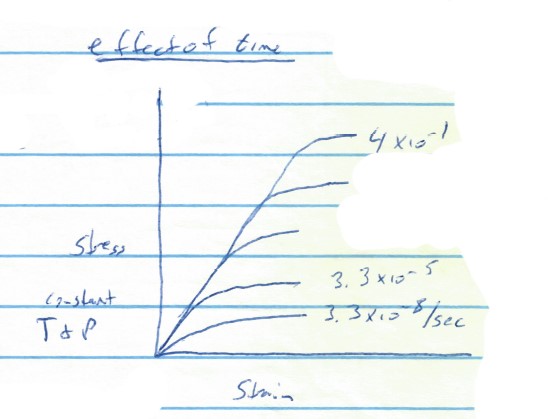
An elastico-viscous material is one that behaves elastically over short periods of time (or fast deformation rates) but viscously over long periods of time (or slow deformation rates). Materials that seem solid, but gradually 'flow' over long times, are elastico-viscous, like ice in a glacier or the icy mountains on an icy moon, or like hot rock in Eath's interior, or like silly putty. If you bounce it, silly putty deforms elastically, storing energy and springing back to make the silly putty bounce. However, if you pull it slowly apart, it will deform like a fluid, not springing back at all. The palimpsests in the picture at the top of this lesson are an example of the viscous behavior of an otherwise solid material over long periods of time.
The graph below shows the effects of time on the behavior of rock--values for deformation rate are given for a few of the curves, deformation rate is the percentage change in some dimension of a material per second. For example, 0.01/sec would correspond to a 1% change in the length of a material in one second. Typical geological deformation rates are on the order of 10-14/sec.
Experimental Tests of Viscous Behavior
Statement of Experimental Question and Approach:
Do sugar water and cornstarch water behave like viscous fluids? The idea will be to test whether the basic nature of viscous materials (in which deformation rate is proportional to force) is true for each material. Different forces will be applied using marbles of different masses under Earth gravity and the deformation rate will be measured by how fast the marble falls through the solution/mixture.
Experimental details: I filled a 50ml graduated cylinder with the solution/mixture of choice, and dropped either a steel marble (1.22cm diameter and mass of 8.0g) or a glass marble (1.3 cm diameter, and mass of 2.6g) into the solution), starting the drop from as close to the surface of the material as possible and beginning timing for the drop at the point that the marble is just submerged (bottom of the marble at about 11.5cm from the bottom for the cylinder that I used). I recorded the drop on video, and then established the time of the drop using the time stamp on the video. The sugar solution was made of 0.5 cup granulated sugar (3.77g) + 0.25 cup water (1.87g) (66.7% sugar by volume, 66.8% by mass). This solution was heated for 2.5 minutes in a microwave to 162°F, stirring after 1.5 minutes and again at the end to dissolve most of the sugar. The cornstarch solution was made of 0.5 cup cornstarch powder (2.40g) and 0.333 cups water (2.58g) (60.0% cornstarch by volume, 48.2% by mass). It was not heated, although it was kept stirred to prevent settling before the experiments.
Philosophical Preamble
Often in classroom experimental science the purpose of an experiment is to reinforce the learned theories, confirming, that "Yep, the scientists got it right--again." Gaining confidence in the scientific process is, perhaps, a valid goal of science education, and certainly making the theories memorable through direct hands-on experience has value. However, indoctrination in the dogmas of science is not quite the same thing as teaching the practices of science, and, in fact, the practices of science as encouraged by the Next Generation Science Standards, and most of the science standards before it, is more about learning how to think through the muddle of real-world observations to extract meaningful patterns and concepts than it is about reinforcing factual learning.
It's hard to do science as a practice in an online lab. After all, I have already done the experiment for you, including choosing what question to ask, choosing an experimental approach, being careful with measurements, and guiding you to figure out what it means. However, we are going to engage in experiments where you at least have to get organized enough to record data, do numerical conversions, calculate values, think about what those values imply, and draw conclusions. So get your pencil, paper, and brain ready.
There will, indeed, be some muddled observations to think through (the fog of science)! In fact, the first of the experiments that I did failed to produce the results that I expected. Before I go on to the later experiments that were designed to address my primary question, I am going to lead you through how I tried to figure out what the unexpected results in the initial 'test' experiment meant. Sometimes in lab reports, students will report that 'experimenter error' caused the results to not be as expected. This is a meaningless claim and should not be included in lab reports. If the experimenter did, indeed, make an error, then that error needs to be identified. Did they read a value wrong on a ruler, graduated cylinder, or thermometer? Did they carelessly not control one of the variables properly, pouring water too fast, or too much, or setting a light source at a wrong angle, etc? Whatever the 'experimenter error' was, it has to be consistent with the exact 'unexpected result' that ensued. I often tell students that, regardless of how careless they are in doing experiments, or what the unexpected result is, it is not possible for them, in the experiment, to break the laws of nature. There is always an explanation for an unexpected results and, sometimes, the greatest discoveries come from pursuing the unexpected to understand what it means. Certainly in the classroom, the whole point of pursuing 'science as a practice' is to figure out what the results that you got mean, not to reinforce or confirm the results that you were already expecting from the theories you learned in class.
First Test: Can I demonstrate with my experimental approach that water--a material known to be viscous--is, in fact, viscous (that is, a Newtonian fluid)?
Before tackling the problem of whether sugar water or cornstarch water behave in a viscous (Newtonian) manner, I wanted to test whether my experimental methodology could yield a 'correct' result for a material of known behavior.
My initial experimental plan hinges on Stokes Law, which states that a falling spherical object of a particular size will reach a terminal velocity proportional to the force on the object such that
Force = (constant1)*ƞ*v
where ƞ is the viscosity, v is the velocity, and Force = the gravitational constant "g" * effective mass of the marble correcting for buoyancy effects
If we have multiple marbles of the same size but different mass falling in a material with constant viscosity (that is, true viscous behavior), we can see that this expression means that
velocity = constant2 * effective mass + 0
This is the equation of a line (y = mx + b) that passes through the origin (0), and thus expresses the idea that deformation rate (velocity) is proportional to force (related to mass). Based on this equation, we can easily test for a constant value of ƞ (that is, viscous behavior) by seeing if the velocity for the drop of the steel and glass marbles, approximately the same size but very different mass, plot on a line that passes through the origin when velocity (the 'y' value) is plotted against mass (the 'x' value) on a graph.
Consider the video below showing two timed drops of a steel marble in plain water. I am going to ask you to provide measured velocities and whether you spot any errors in the experiments, so watch this video carefully and measure the velocity according the the planned experimental method listed above in "experimental details." To facilitated the measurement of velocity, I have slowed down the marble drop by a factor of 10 (thus, to calculate velocity, you will have to divide the time by a factor of 10. Also, remember that velocity = distance/time). You may need to watch the video more than once and manually run the video back and forth to find the exact start and stop times that you need. Record your results and calculate velocities.
Consider the video below showing two timed drops of a glass marble in plain water. Again, I am going to ask you to provide measured velocities. I have again slowed down the marble drop by a factor of 10 (thus, to calculate velocity, you will have to divide the time by a factor of 10--remember velocity = distance/time). You may need to watch the video more than once and manually run the video back and forth to find the exact start and stop times that you need. Record your results and calculate velocities.
So, why might our experiments have shown non-viscous (non-Newtonian) behavior when we know from prior experimentation that it should be truly viscous (Newtonian)?
What have we missed?
Review our original premise for this experiment derived from Stoke's Law (our premise is reproduced below). Can you identify any potential issues with our experiment?
- My initial experimental plan hinges on Stokes Law which states that a falling spherical object of a particular size will reach a terminal velocity proportional to the force on the object such that
- Force = (constant1)*ƞ*v
- where ƞ is the viscosity, v is the velocity, and Force = gravitational constant "g" * effective mass of the marble correcting for buoyancy effects
- If we have multiple marbles of the same size but different mass falling in a material with constant viscosity (viscous behavior), we can see that this expression means that
- velocity = constant2 * effective mass + 0
The equation we chose for Stokes Law in our premise above assumed marbles of equal size. Although I chose marbles that were close to each other in size, they differed slightly. Might this account for our discrepancy?
A more complete expression of Stokes Law would be:
g * (effective mass) = 6*π*ƞ*r*v
where r = particle radius, π =3.14159, and other values are as defined above.
rearranging, we get
v = constant3 * effective mass/r + 0
notice that the equation now includes a term mass/r rather than mass-only.
We can do a similar graph to the graph above, but plotting against mass/r instead of mass only to correct for our difference in marble size. That graph is shown below (the graph plotted against mass only is also shown for comparison)
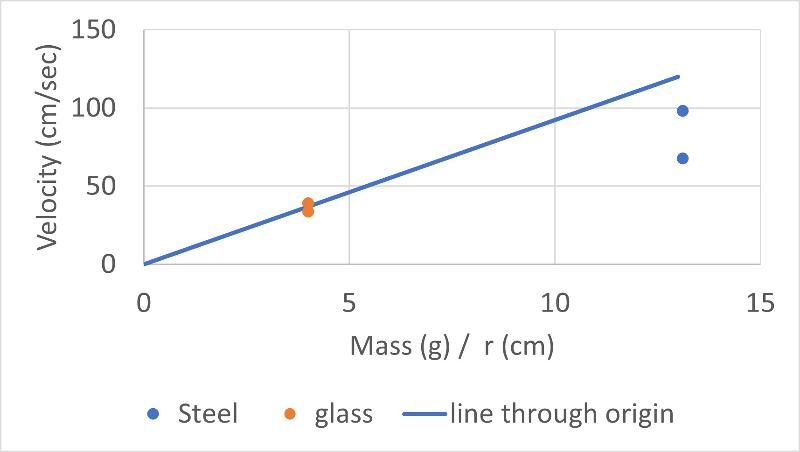
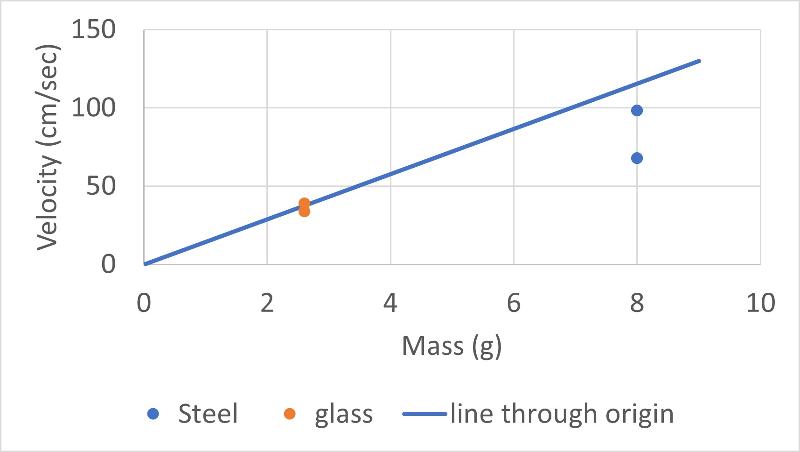
We see that considering differences in marble size cannot account for our discrepant results for marble drop velocities in water. Another possible factor that we identified that might cause our discrepant result was the effects of buoyancy on the force applied by each marble (we considered the analogy that a wooden marble would not sink at all and if we didn't consider buoyancy this wouldn't make any sense in terms of Stokes Law).
We can consider the effects of buoyancy by considering the mass of the water that is displaced by the marbles. That is, volume of marble * density of water = mass of displaced water. The "effective" mass can be thought of as the mass of the marble less the mass of the displaced water.
The formula for volume of a sphere is 4/3 * π * r3 and the density of water is about 1 g per cc.
Therefore, the mass of displaced water for the steel marble is
4/3 * π * 0.613 = 0.951 g
The mass of the displaced water for the glass marble is
4/3 * π * 0.653 = 1.15 g
Still considering the following relationship between mass and velocity from Stokes Law defined above
v = constant3 * effective mass/r + 0,
we can plot our data on a graph of velocity versus effective mass/r, as shown below. The graph for marble mass (uncorrected for buoyancy) /r is shown for comparison.
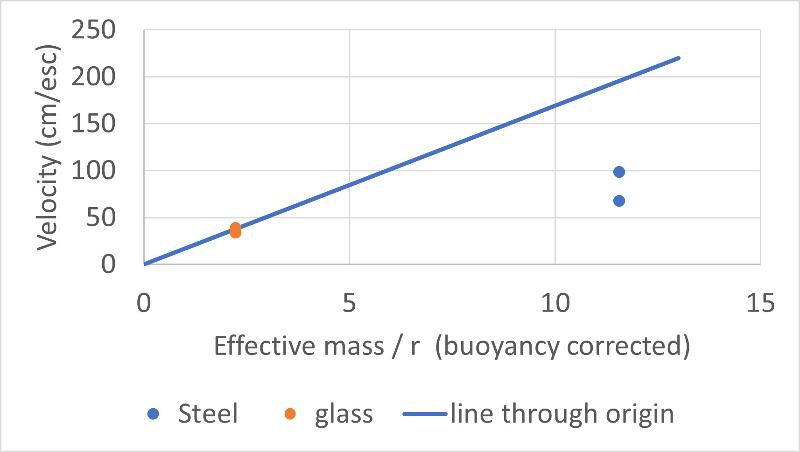
So, buoyancy is definitely a factor we need to consider going forward, but it did not explain our discrepant results.
We still have one more factor that we identified above as a possible problem in our experiments that might account for the seemingly non-viscous (non-Newtonian) behavior of water. That is, terminal velocity may not have been reach and therefore Stokes Law is not valid.
If this is the case, then the marbles would actually be accelerating during the drop, and our 'average' velocity measurement may not even be meaningful. We have some evidence that a steady state terminal velocity is not reached in the first trial with the steel marble. When we accidentally dropped the steel marble from a height well above the water surface, the average velocity we measured was 50% higher than when we dropped the marble right at the surface. However, if we were at terminal velocity for most of the drop distance, we would expect the 'too high' drop height not to have a big effect because the velocity would quidkly drop to terminal velocity once the marble hits the water.
Thus, we already have some evidence that we may not be reaching terminal velocity, at least for the steel marble.
If that is the case, then Stokes Law is no longer valid and the math gets a lot more complicated. Velocity will be changing during the experiments in different ways and the steel and glass marbles may have approached terminal velocity by different degrees or not at all.
We can maybe approximate a mathematical solution by considering the following relationships:
- v = a*t (velocity = acceleration times time)
- F=m*a. (force = mass times acceleration)
Recombining equations we get the following
- v = F*t/mass (velocity = force times time divided by mass
Also, the forces acting on the marble are the force of gravity on the marble itself, minus the buoyancy force, minus the 'friction' caused by the fluid viscosity
- F = (g*effective mass) - k * r * ƞ * v (k is a constant)
- or v = g*effective mass)*t/mass - k * r * ƞ * v * t/mass
Rearranging to give us viscosity on one side of a linear equation (so we can test for linearity on a graph) gives us
- k ƞ/mass = g*effective mass *t/mass-v)/v*t*r
from which we can derive an equation in the form of a line as the following
- g*effective mass *t/mass-v)/v*t*r = constant4 * (1/mass) + 0 (y = mx + b)
Whew, a lot more complicated and not even quite valid because the equation doesn't take into account changing velocity with time (we'd need to use calculus for that!)
But we can maybe see if considering that our marbles did not reach terminal velocity moves our data in the right direction (toward viscous behavior) by considering the graph of our data shown below
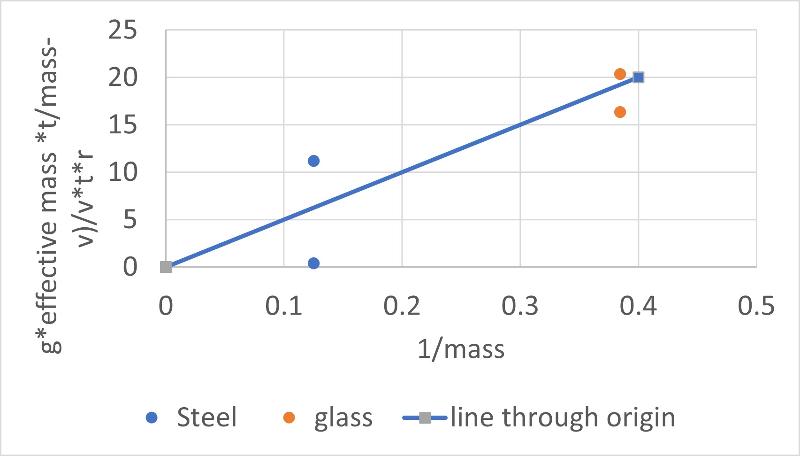
So, does failure to reach terminal velocity account for the discrepancy in our initial experiments?
Well, maybe. The data now fall along a linear trend, as seen in the graph. However, that is due in large part to the fact that the calculation now accentuates the variation in the values for our first and second trials with the steel ball, causing the measurements to vary so widely that they don't really confirm viscous (Newtonian) behavior in any meaningful way. Also, we know our equation is not taking into account changes in velocity with time (just using an average velocity).
Because of the very high drop velocities, particularly with the steel marble, it is also possible that another factor, which we did not consider above, is playing a part in the results. It is possible that turbulent movement of the water is also a factor. Turbulence can increase the drag on the marbles beyond what might be expected from viscosity alone.
Thus, my effort to test for the viscous (Newtonian) behavior of water with simple classroom-accessible materials is a bust. The best way to improve this would be to redesign the experiment so as to give the marble a much longer drop range to allow it to reach terminal velocity (and even then turbulence might be a factor).
The good news is this: We are wanting to test for the viscous behavior of sugar water and cornstarch water, which have much higher viscosities and so will reach terminal velocities much quicker and are less likely to be affected by turbulence!
Onward!
Second Test: Does sugar water behave in a viscous way (as a Newtonian fluid)?
Reminder of our expeirimental goals and methods from the top of this lesson:
Do sugar water and cornstarch water behave like viscous fluids? The idea will be to test whether the basic nature of viscous materials (in which deformation rate is proportional to force) is true for each material. Different forces will be applied using marbles of different masses under Earth gravity and the deformation rate will be measured by how fast the marble falls through the solution/mixture.
Experimental details: I filled a 50ml graduated cylinder with the solution/mixture of choice, and dropped either a steel marble (1.22cm diameter and mass of 8.0g) or a glass marble (1.3 cm diameter, and mass of 2.6g) into the solution), starting the drop from as close to the surface of the material as possible and beginning timing for the drop at the point that the marble is just submerged (bottom of the marble at about 11.5cm from the bottom for the cylinder that I used). I recorded the drop on video, and then established the time of the drop using the time stamp on the video. The sugar solution was made of 0.5 cup granulated sugar (3.77g) + 0.25 cup water (1.87g) (66.7% sugar by volume, 66.8% by mass). This solution was heated for 2.5 minutes in a microwave to 162°F, stirring after 1.5 minutes and again at the end, to dissolve most of the sugar. The cornstarch solution was made of 0.5 cup cornstarch powder (2.40g) and 0.333 cups water (2.58g) (60.0% cornstarch by volume, 48.2% by mass). It was not heated, although it was kept stirred to prevent settling before experiment.
Watch the video below showing the drop of the steel marble in the sugar water solution. As before, please measure the drop time (the video is again slowed down by x10) and calculate the average drop velocity.
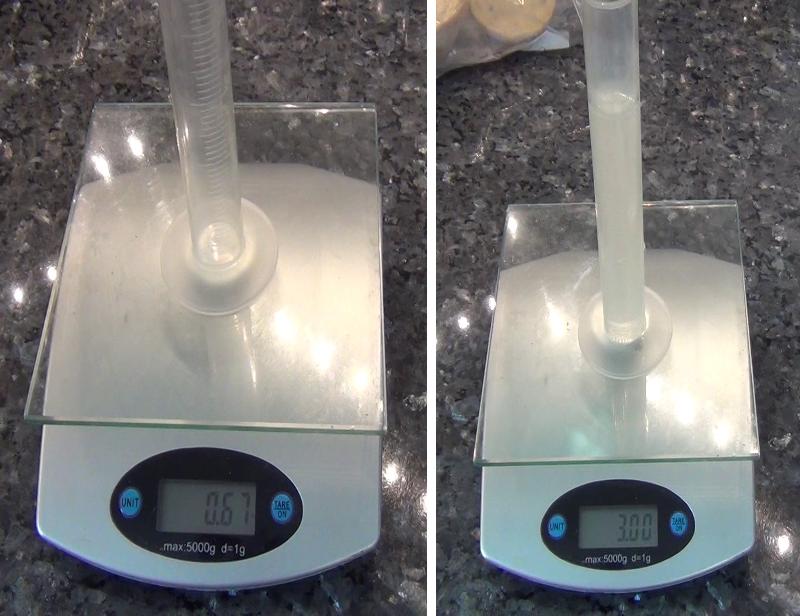
Remembering that buoyancy is an important factor, we need to measure the density of the sugar water solution in order to determine the buoyancy factor (remember, we corrected for buoyancy by subtracting the mass of the displaced water from the mass of the marble).
The images below show the weight (in ounces) for the empty graduated cylinder and the weight (in ounces) for the graduated cylinder plus 50 millilters of sugar water solution (note: you will need to convert values to grams for the next question, also 1 milliliter (ml) = 1 cubic centimeter (cc or cm3).
Watch the video below showing the drop of the glass marble in the sugar water solution. As before, please measure the drop time (the video is again slowed down by x10) and calculate the average drop velocity.
Third Test: Does cornstarch water behave in a viscous way (as a Newtonian fluid)?
Unlike sugar, cornstarch does not dissolve in water, but remains as suspended small particles. This causes the cornstarch water to be quite opaque making it difficult to spot the movement of the marble through the mixture. I had to watch the videos many times before I spotted the 'tells' that revealed when the marbles reached the bottom. Rather than have you try to find those tells (which you would need to do in your own classroom experiment) I give you hints for what I found.
Watch the video below showing the drop of the steel marble in the cornstarch water mixture. Although iIt's nearly impossible to see the marble reach the bottom in this video, try to get the start time for the drop. Some notes: I put a flashlight behind the graduated cyclinder in an effort to make the descending marble more visible, but this had only limited effectiveness. Also, because I could often only locate the center of the marble for several intermediate velocity calculations that I attempted, I chose my start time when the center of the marble was at the surface of the liquid in this case (rather than when it was just submerged as in the previous experiments)
The video below shows a close up of the bottom of the graduated cylinder during the same steel marble drop as shown above. As before, please measure the drop time (the video is again slowed down by x10) and calculate the average drop velocity. I include hints for the 'tells' that I spotted in this video.
The video below shows the glass marble drop in the cornstarch water. As before, please measure the drop time (the video is again slowed down by x10) and calculate the average drop velocity. The 'tell' for the arrival of the glass marble at the bottom is much easier to spot than with the steel marble drop, and I leave you to try to find it yourself.
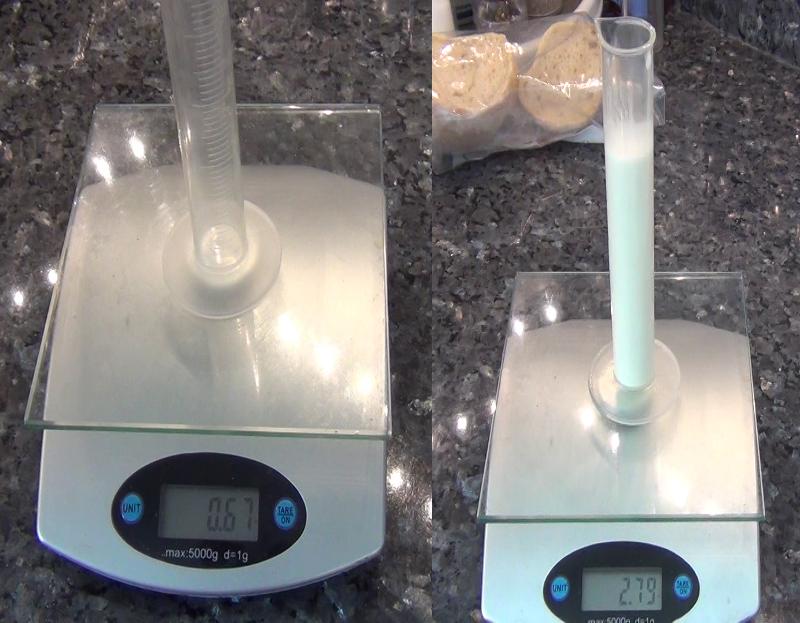
To account for the buoyancy effect, we need to measure the density of the cornstarch water mixture. As with the sugar water, this can be determined from the measurements below. Rather than have you go through this calculation again, I will simply give you the value:
mass = 2.12 oz * 28.3495 g/oz = 60.1 g
density = mass/volume = 60.1 / 50 ml = 1.20 g/cc
Thus, for a cornstarch-water mixture, rather than deformation rate being proportional to force, we see that a greater force causes greater resistance to deformation This is a characteristic of "ooblic," a mixture of cornstarch and water that resists when we push or squize it hard, but then flows like water through our fingers when we ease the force applied.
last updated 4/11/2023. Text and pictures are the property of Russ Colson, except as noted.