Landscape Review, with Maps
Earth Science Extras
by Russ Colson
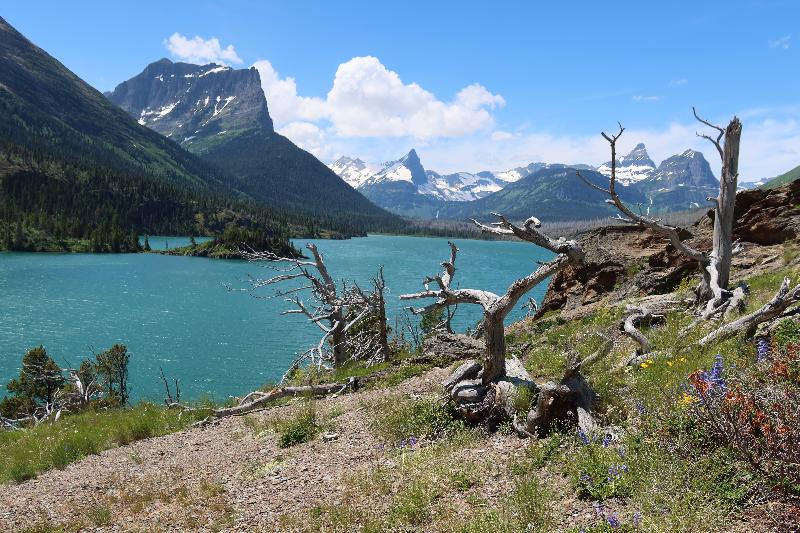
St Mary Lake as seen from Sun Point in Glacier National Park. St. Mary is a glacial valley lake and the mountain features seen in the background include glacial arrêtes and horns, thus, this is a classic landscape shaped by alpine glaciation of the past. Due to climate change, the modern glaciers in Glacier NP are rapidly disappearing and may soon be gone, but the landscape those, and more ancient glaciers, fashioned lives on.--picture taken by Russ Colson, July 2022.
Invitation to a Game:
We're going to look at a variety of landscape maps and try to figure out what aspect of the landscape the maps are portraying! I encourage you to think of this as being like a game--how many of the maps can you figure out based on your knowledge of US and world geography? If you get stumped, feel free to look things up online. I encourage looing things up online rather than simply trying to 'click through' the answers below, because 'clicking through' is not a learning experience whereas trying to figure out the problems, and looking things up when you get stumped, IS a learning experience. The exercises in this lesson are not intended to teach you the about types of landscapes or landform processes--you should already know that before taking this review--but it will give you a chance to think again about the many different ways that landscapes can be portrayed on maps and what landscapes tell us about our world. But to gain that opportunity to 'think again,' you need to engage with the maps and what the maps portray, and not simply 'click through. Remember, as with all learning that is worthwhile, the goal is not to "know an answer" but rather to figure out problems and puzzles, in this case, problems and puzzles that engage you in thinking about spatial data and what that data tells us.
Landscape Provinces:
1) Consider the map below showing geological provinces around the world (public domain map from the US Geological Survey as adapted from Wikipedia, 2022).
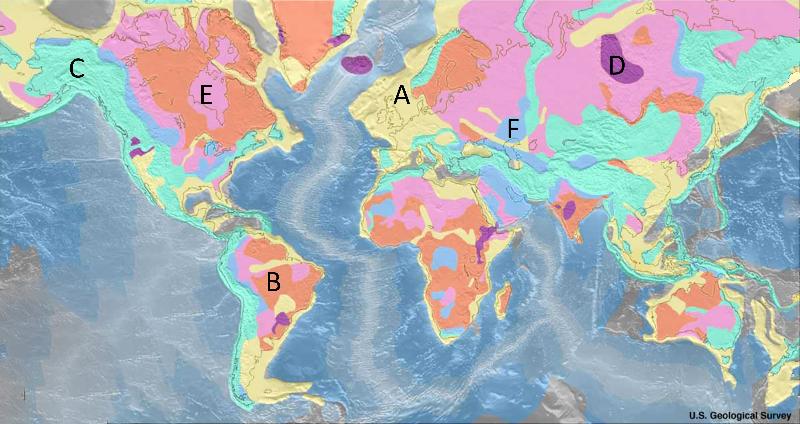
You might also note some 'extras'-- do you notice the band of 'extended crust' going from Kansas up along the North Shore of Lake Superior? What do you suppose that is related to? Hint: the volcanic deposits along the North Shore are related to a Precambrian tectonic boundary -- what kind of boundary might it have been?
Also, the map shows ocean floor features related to plate tectonics, including ridges at divergent boundaries and trenches at convergent boundaries where there is subduction occuring. Can you find them and tell them apart (hint: the trenches are somewhat obscured by the adjacent presence of volcanic island arcs marked as orogenic belts)?
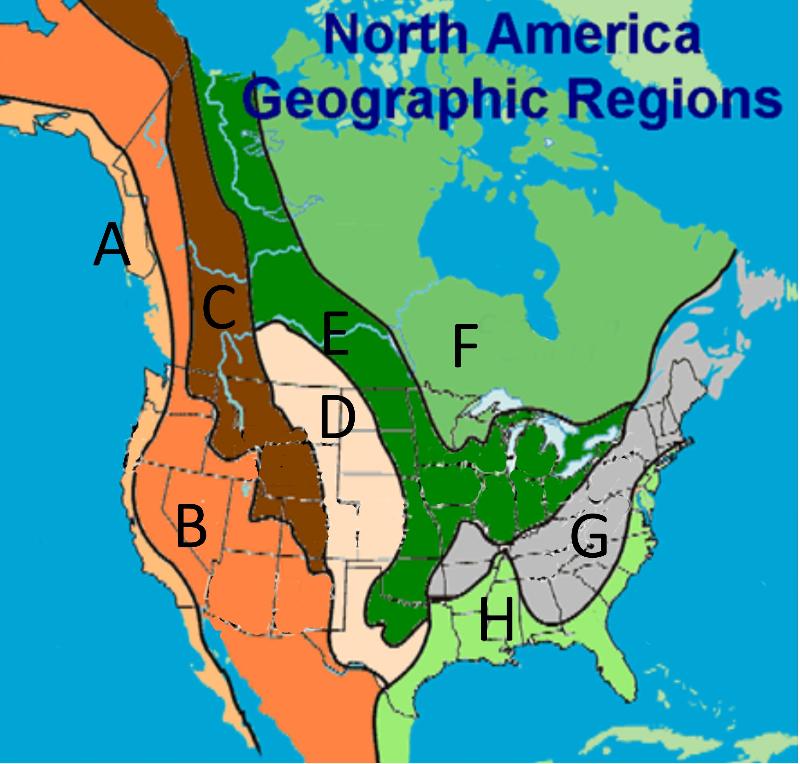
2) Consider the map below showing the geographic regions of North America (Adapted from the Virginia middle school geography standards online document:https://www.solpass.org/6ss/Standards/standard_us1.2b.htm).
3) Consider the map below showing the geographic regions of North Dakota (adapted from No Ordinary Plain: North Dakota's Physiography and Landforms, by John Bluemle and Bob Biek, North Dakota Geological Survey, https://www.dmr.nd.gov/ndgs/ndnotes/ndn1.asp)
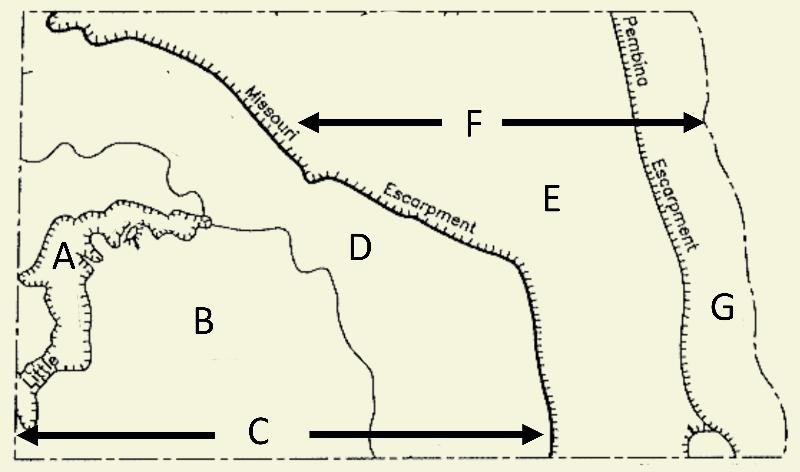
You might note some 'extras.' What do you suppose that the Pembina Escarpment and Missouri Escarpment are and how did they form? Hint: For the Missouri River feature, think about the formation of river valleys and flood plains by erosion and the migration of rivers through time and the features that border rivers and flood plains. For the Red River feature, think about how the Red River valley formed and what features border it where lake waves eroded into surrounding sediment.
Also notice the 'tic marks' along the outskirst of the badlands in the west. What does this mean about the "hills" of the badlands? Are they higher or lower than the surrounding flat landscape? HInt: tic marks on a topo map designate a depression rather than a hill.
4) Consider the map below showing geographic regions of Minnesota (Adapted from Wikipedia: public domain, https://en.wikipedia.org/wiki/Geology_of_Minnesota#/media/File:MNGeolRegions.GIF)
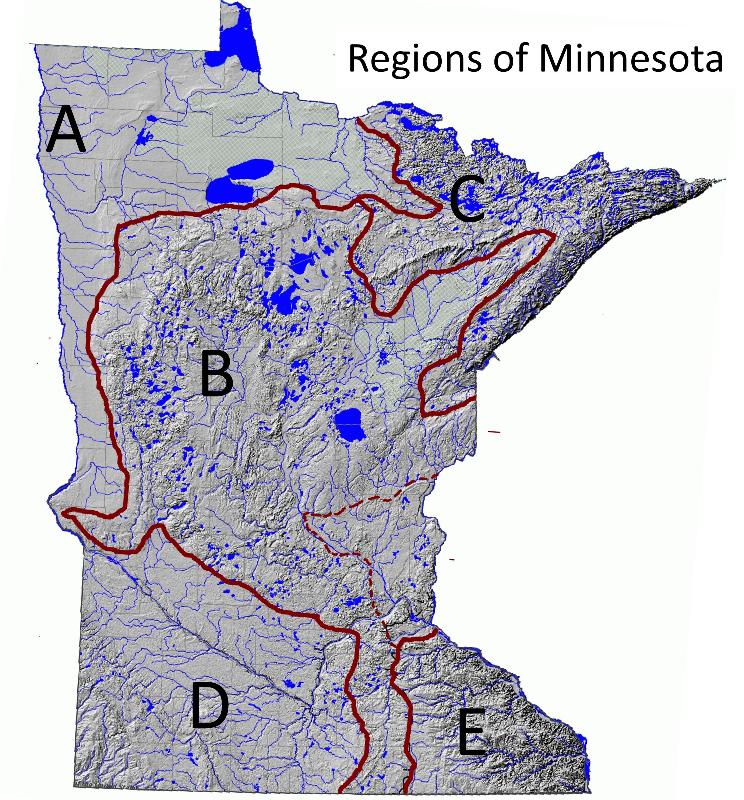
Extra: notice that the kinds of features chosen for the landscape maps of North Dakota and Minnesota are somewhat different, that is, they are not the same features occuring in different locations, nor are they even features that come from the same classification system. Landscape maps are usually taylored to each region mapped, taking into account the unique features of each region, and don't usually fit into some "global landscape classification system." In fact, even in one region, we might define different geomorphic or geophysical regions based on slightly different criteria for defining 'like' regions. No two areas of any particular landscape are ever exactly alilke and so, to create geophysical 'provinces,' we must define regions that share common, generalized elements. The criteria for those generalized elements might be different from one mapper to another, or from one purpose to another, thus making possible multiple, different mapped provinces even in a single region. Coputer-assisted Geographical Information System (GIS) mapping methods make it possible to choose a variety of criteria on which to base a map, to apply various statistical tests to find common 'groups' of criteria over a particular region, and create maps based on those criteria.
Identifying types and characteristics of physical feature maps--without the legend!--a reasoning and knowledge challenge:
Consider the set of 6 maps shown below, illustrating a variety of different physiographic or physical environment features (sources, citations, and copyright status for maps are given at the end of this lesson).
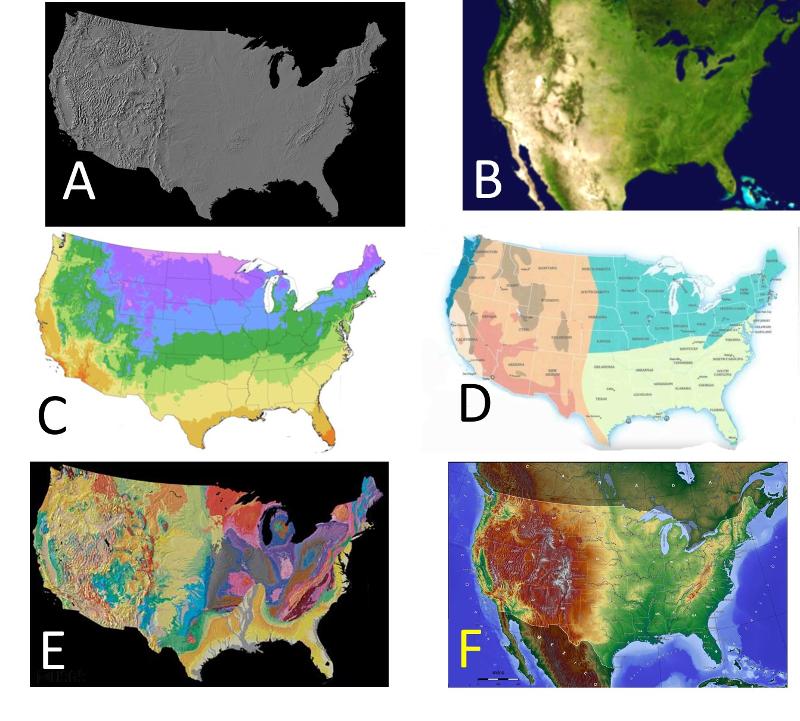
Some extras: Can you notice any correlations among the different maps? For example, does topography have any effect on climate or hardiness zone? If so, what is the evidence, and if not, what is the evidence? Hint: you might check out whether the climate or hardiness zone maps have features that appear to be deflected by mountain ranges, such as the Appalachians.
Also, is there any correlation between the climate zone map and the vegetation seen in the satellite composite? How do you know? HInt: notice the north-south trend of the transition from abundant vegetation to much less vegetation--is there any comparable trend seen on the climate zone map?
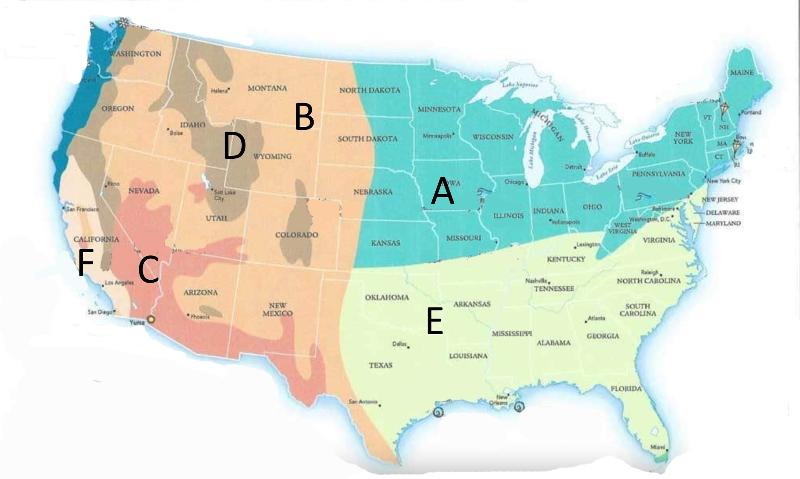
Take a closer look at the climate zone map below. Try to figure out which climate zone goes where.
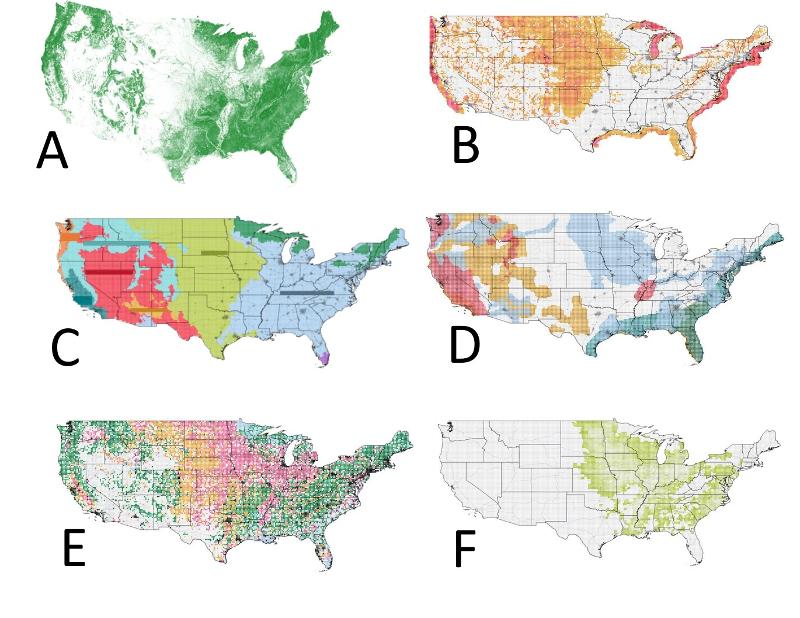
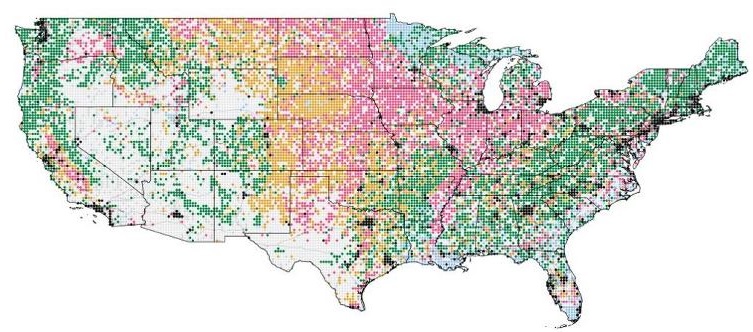
Consider the 6 maps shown below showing a variety of land uses, ecosystems, risks, and use potential. (sources and citations for maps are given at the end of this lesson).
Note: If you did not carefully read the feedback for the question above, please do so now as there are additional questions to think about there. In general, you should ALWAYS read the feedback I give on the questions as this is where you get insight into my reasoning and the reasoning that goes into solving these problems. "Knowing the answer" is of very little value--the whole purpose is to learn to think, and the feedback can give insight into that!
Take a closer look at the Land Use map below. Can you identify which colors correspond to the different usages?
Correlating common landforms with underlying geology
Landforms result from a variety of factors, including the following:
- Erosion (sediment is removed by wind, water, ice, etc)
- Deposition (sediment is deposited by wind, water, ice, etc)
- Uplift (landscape is rising relative to sea level or to surrounding regions)
- Subsidence (landscape is sinking relative to sea level or to surrounding regions)
- Nature of the underlying rock, its orientation and resistance to erosion (for example, rocks may be tilted or horizontal, with some layers resisting erosion more than others)
Based on an elementary understanding of landforms, You can figure out which landforms might be formed by deposition or erosion. For example, which of the following are depositional landforms?
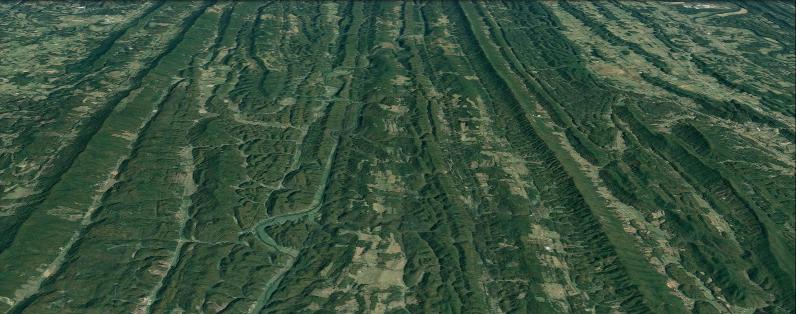
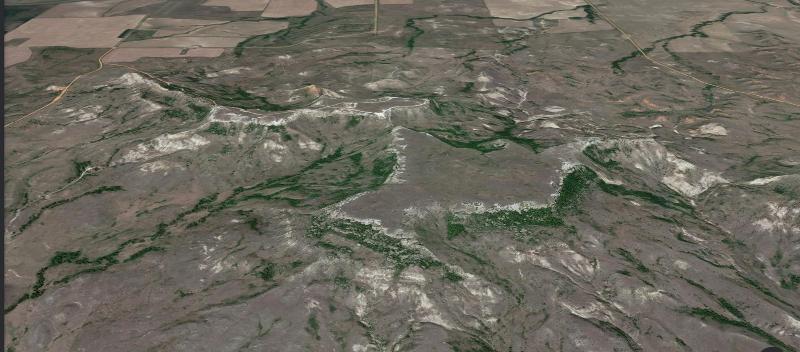
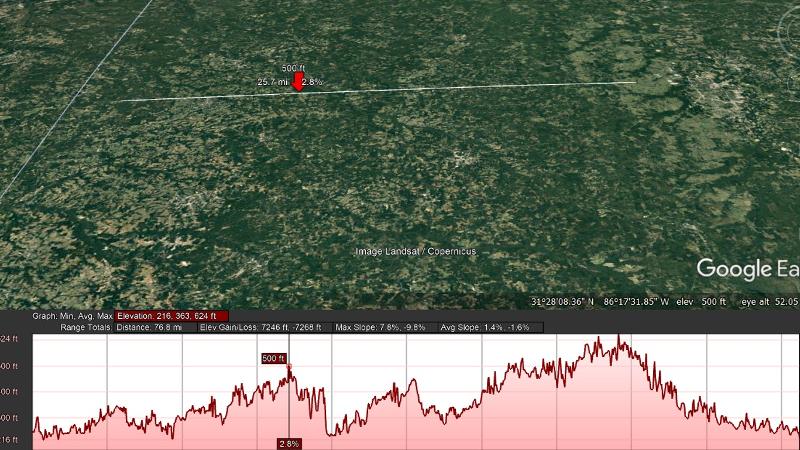
By considering how underlying rock and its orientation will affect erosion and the formation of landforms, you can predict the orientation or type of rock underlying many landforms. Try it with the challenges below! Landscape images are made using either Google Earth Pro or Google Earth online and are based on aerial or satellite imagery.
The landscape below is near Shiloh Tennessee, just south of the "toe" of western end of Virginia, looking toward the northeast.
The picture below shows Sentinel Butte in western North Dakota.
The picture below shows the coastal plain south of Montgomery Alabama, along with a topographic profile (drawn along the white profile line by Google Earth Pro).
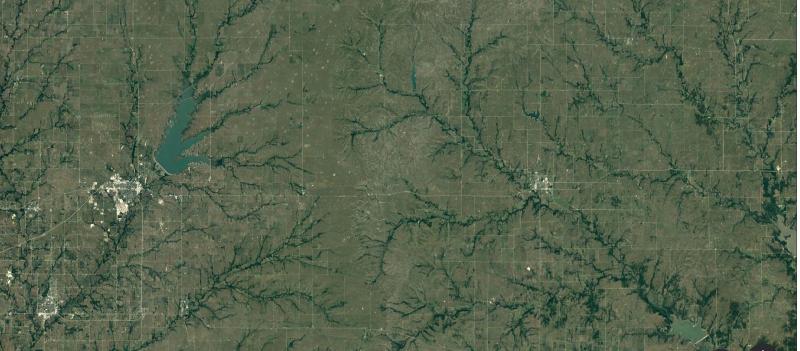
The landscape below is from near Eureka Kansas.
The image below comes from a short distance ENE of Atlanta, GA.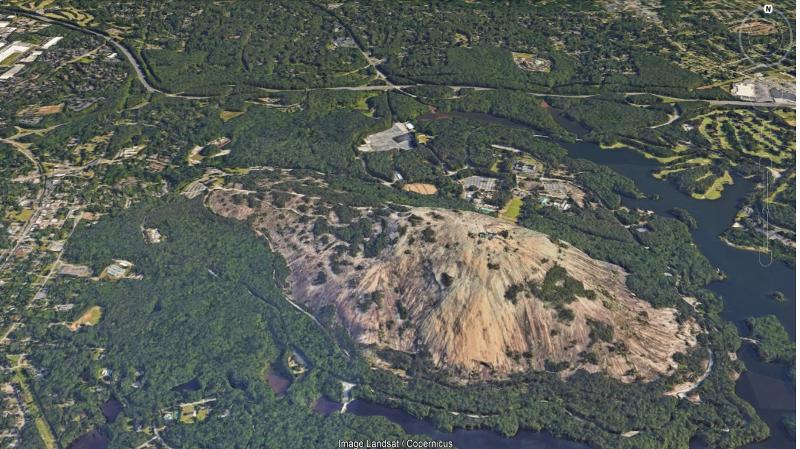
Additional Sources: Climate map is modified from GeoNova, a GIS org of Nova Scotia that has map products for general or educational use; the topographic elevation map is under copyright, but can be used if properly attributed as follows: CC BY-SA 3.0 https://creativecommons.org/licenses/by-sa/3.0/; with the creative commons license available at https://creativecommons.org/licenses/by-sa/3.0/legalcode; the plant hardiness zone map is The 2012 USDA Plant Hardiness Zone Map, https://www.usna.usda.gov/science/plant-hardiness-zone-map/ ; the satellite plant cover image is from NASA and is in the public domain, https://upload.wikimedia.org/wikipedia/commons/0/03/USA-satellite.jpg; The geological age map is from U.S. Geological Survey, Geologic Investigations Series 2720, A Tapestry of Time and Terrain, By José F. Vigil, Richard J. Pike, and David G. Howell, 2000, https://pubs.usgs.gov/imap/i2720/ ; The landforms map is Landforms Map of the Conterminous United States, Educational Resources, USGS, public domain, https://www.usgs.gov/media/images/landforms-map-conterminous-united-states ; the tree map is under copyright, and was accessed at https://www.prnewswire.com/news-releases/us-tree-map-earthdefine-creates-the-most-detailed-map-of-americas-trees-301151010.html, with copyright owned by Earthdefine http://www.earthdefine.com/ and was made by AI processing of aerial imagery from National Agriculture Imagery Program (NAIP), https://www.earthdefine.com/treemap/ ; the ecoregion, environmental risk, land use, wind energy potential, and soybean producation maps are all from the McHarg Center project 2100 an Atlas for the Green New Deal, https://mcharg.upenn.edu/2100-project-atlas-green-new-deal ;
last updated 8/13/2022. Text and pictures are the property of Russ Colson, except as indicated.